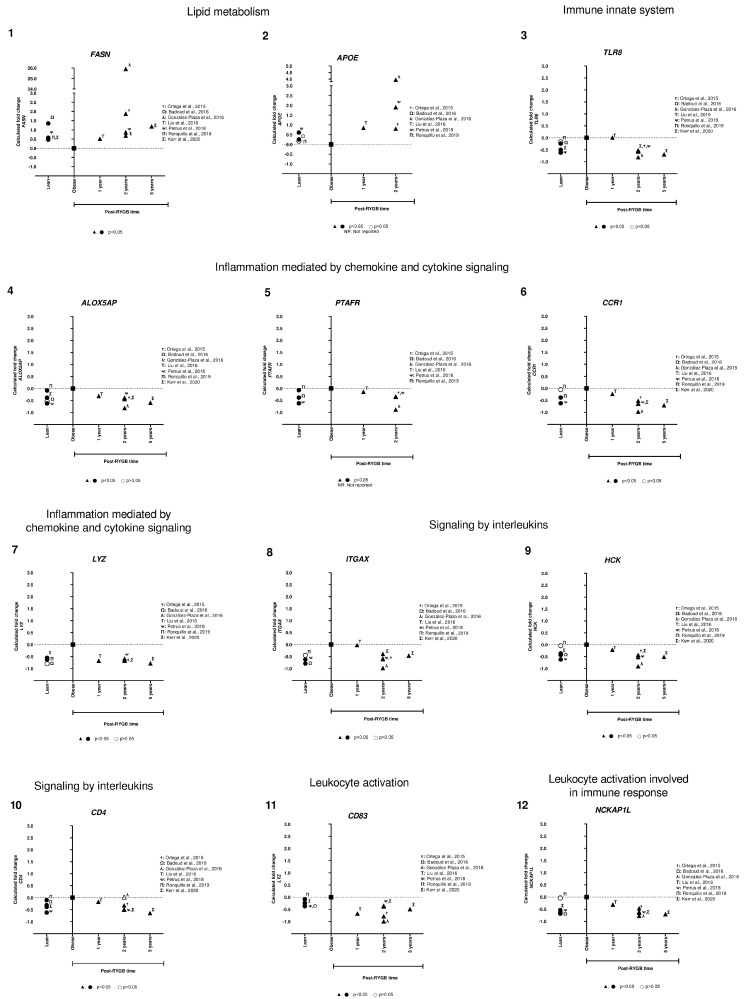
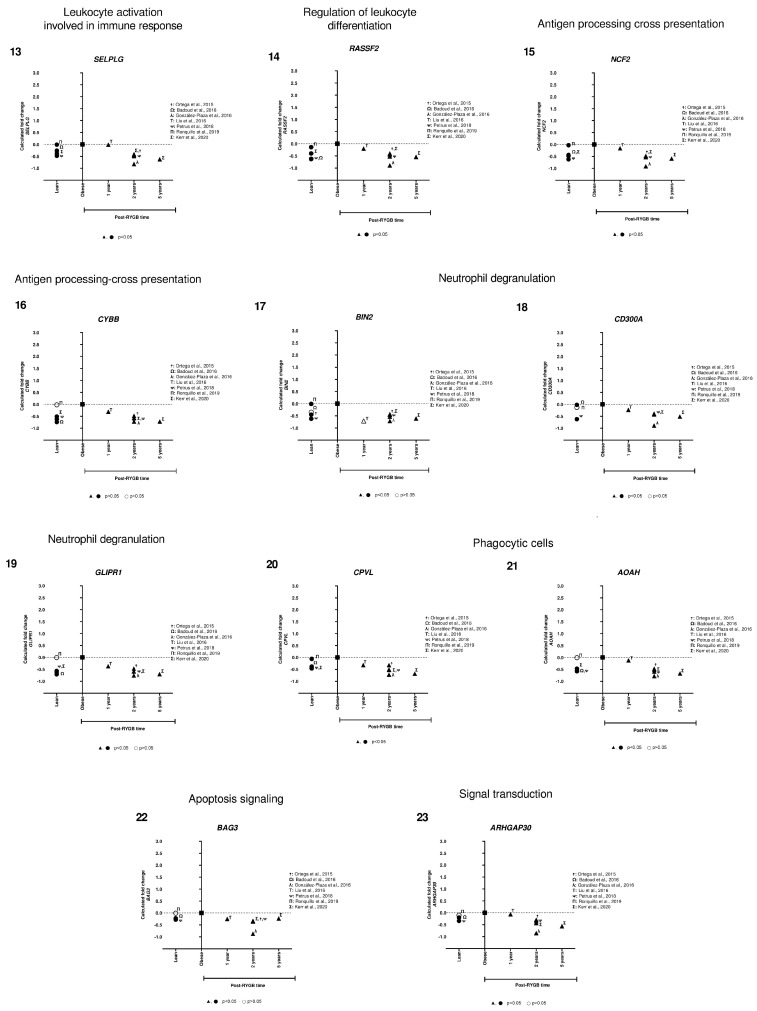
Figure 5.
Subcutaneous adipose tissue transcriptomic gene expression among lean, obese, and post-RYGB (different timepoints). Comparison of expression levels of each gene among different studies, identified by the author (☨: [47]; Ω: [51]; λ: [41]; Τ: [44]; ᴪ: [48]; Π: [50]; Σ: [32]). Calculated fold change was significant (p-value < 0.05, ▲, ●) or not (p-value > 0.05, △, ○).


