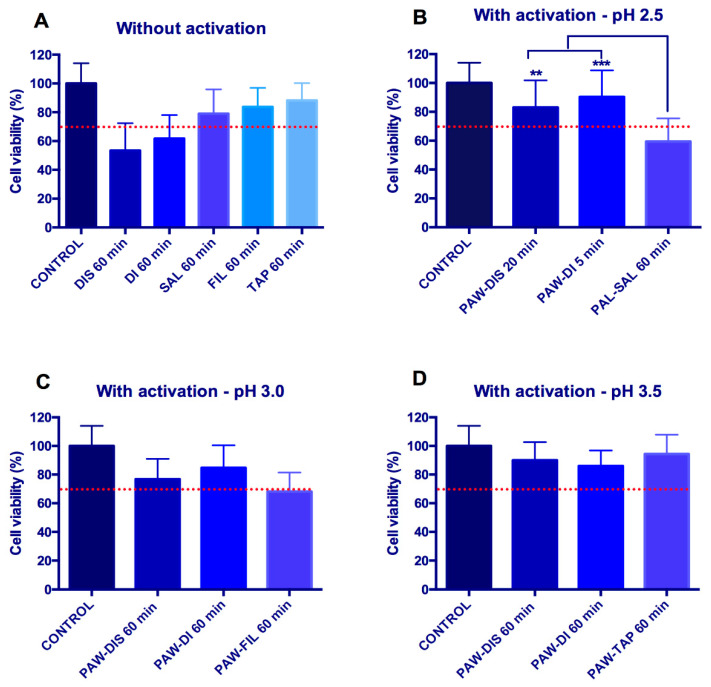
Figure 6.
Graphics showing the percentage of viable cells obtained with MTT assay. (A) Liquids without plasma activation. (B–D) Liquids with plasma activation. The most antimicrobial liquids were evaluated in the shortest exposure time for pH = 2.5 (B), pH = 3.0 (C) and pH = 3.5 (D). The dashed line represents the normative value of cell viability (70%). (** p < 0.01; *** p < 0.001 indicate statistical differences.)

