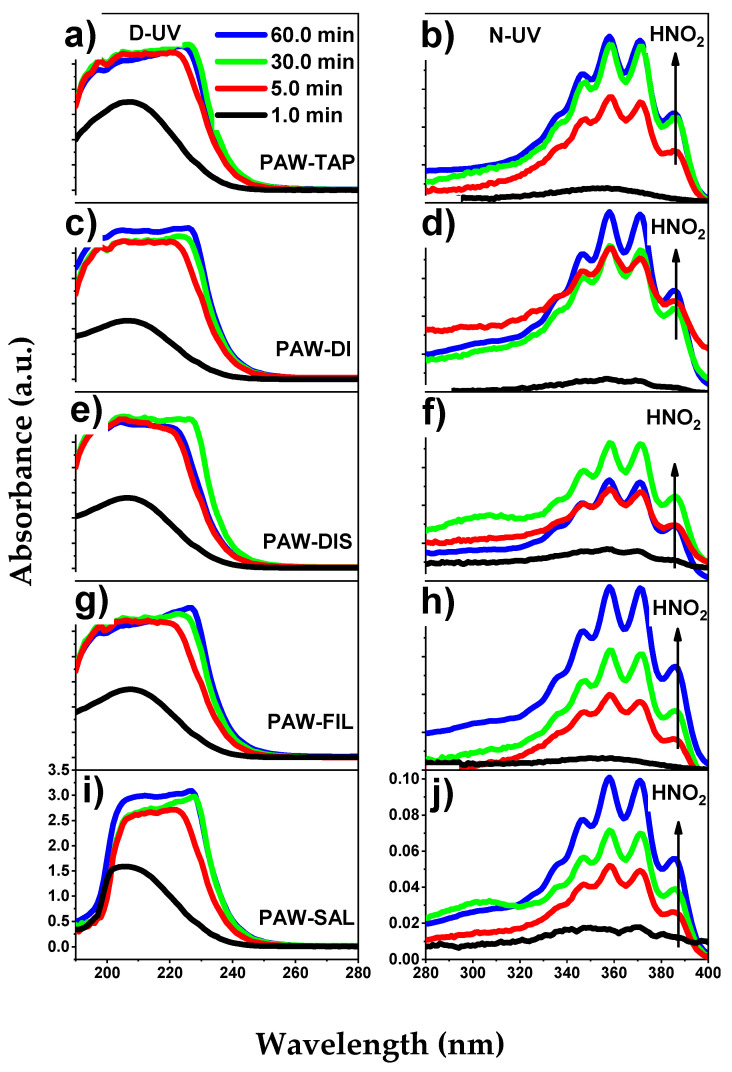
Figure 9.
UV absorption spectra of activated liquids for 1.0, 5.0, 30.0, and 60.0 min. (a,c,e,g,i) represent the deep UV absorption spectra of tap water, deionized water, distilled water, filtered water, and 0.9% saline solution that were activated. (b,d,f,h,j) represent the near UV absorption spectra of tap water, deionized water, distilled water, filtered water, and 0.9% saline solution that were activated with the pattern of HNO2 formation.

