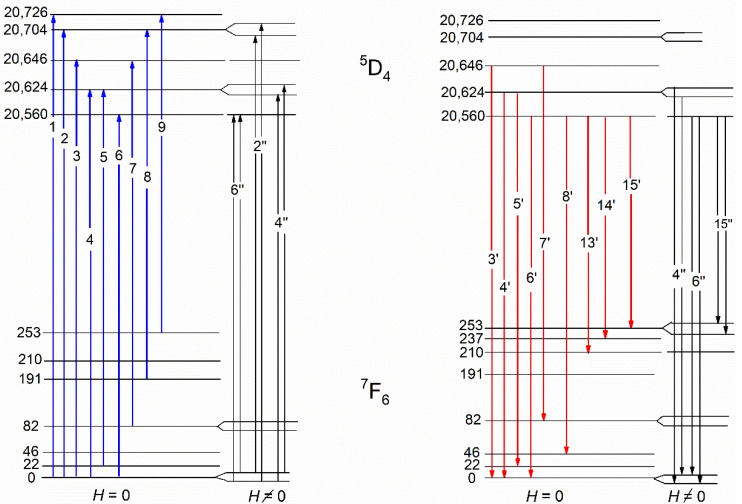
Figure 5.
The scheme of Tb3+ optical transitions in a KTF crystal, constructed according to the absorption (blue arrows) and PL (red arrows) spectra at T = 90 K. The diagrams of magnetically–optically active transitions in Tb3+ ions, realized in the magnetic field H in the low-temperature spectra of MCD and MCPL, are shown on the right parts.

