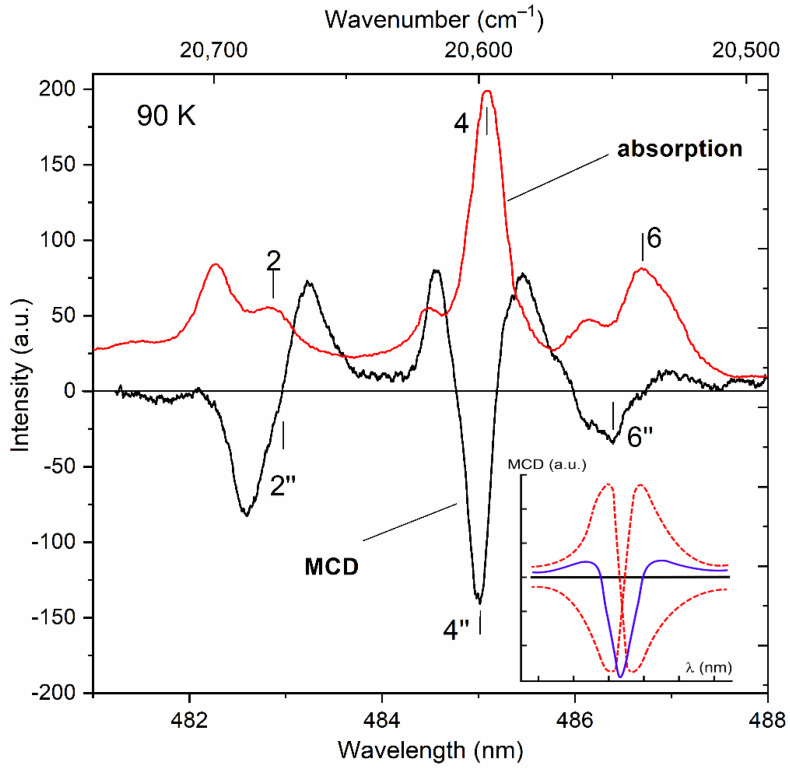
Figure 6.
Spectral dependences of the MCD (red solid) and optical absorption (black line) of the KTF crystal at T = 90 K. The MCD spectrum is recorded in a magnetic field H = 5 kOe. The characteristic features of the MCD and absorption spectra are indicated in accordance with the transition scheme (Figure 5). The insert shows the result of the superposition of two opposite (in sign) spectral dependences of the MCD corresponding to the “diamagnetic” contributions to the MCD in the studied spectral region.

