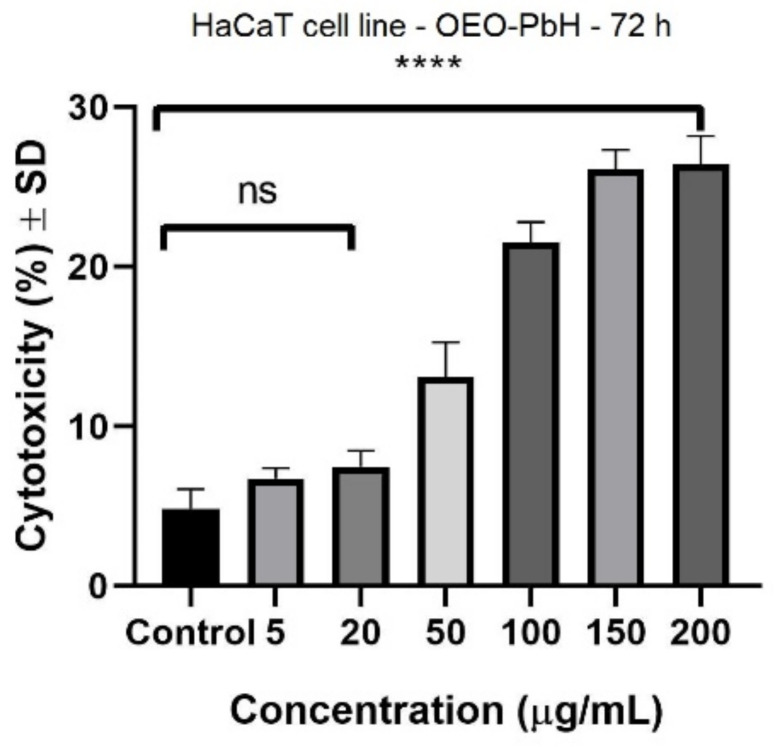
Figure 6.
The cytotoxicity of different concentrations of OEO-PbH (5, 20, 50, 100, 150, 200 µg/mL) at 72 h post-stimulation. Data are represented as mean ± SD. Comparison among groups was made with one-way ANOVA and Dunnett’s multiple comparison test (**** p < 0.0001 vs. Control; ns = not significant).

