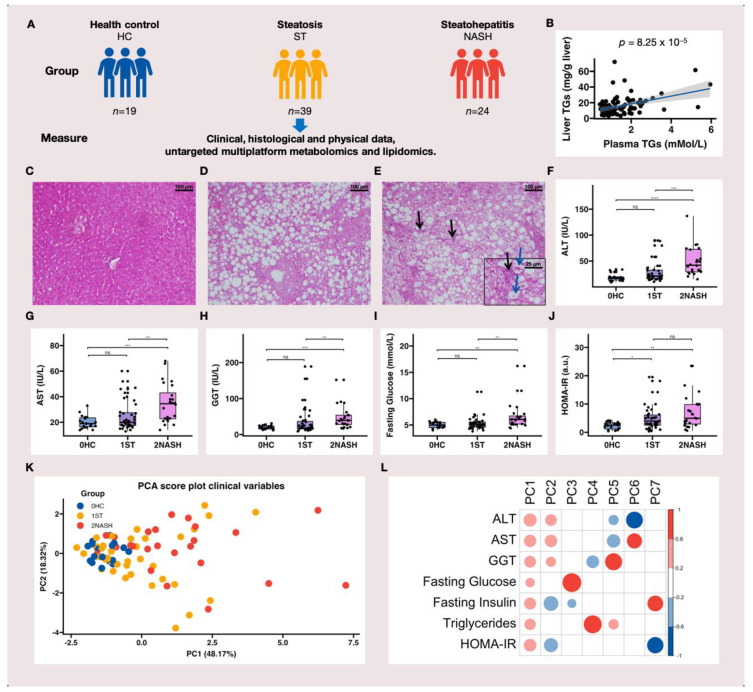
Figure 1.
The associations between clinical characteristics and MAFLD: (A) a simplified diagram of the study design; (B) the correlation between plasma and liver TGs; (C–E) the results of the liver histological analysis using hematoxylin–eosin staining on the different groups of patients ((C) a normal liver (HC) from a 30-year-old woman, magnification 100× (scale bars: 100 μm); (D) steatosis (ST) from a 30-year-old woman showing “isolated” macrovacuolar steatosis affecting 60–90% of hepatocytes without inflammation, ballooning and fibrosis, magnification 100× (scale bars: 100 μm); (E) non-alcoholic steatohepatitis (NASH) from a 40-year-old woman showing macrovacuolar steatosis affecting 60–90% of hepatocytes with inflammation (black arrows) and ballooning (blue arrows), magnification 100× (scale bars: 100 μm), inset 400× (scale bars: 25 μm)); (F–J) the clinical and biochemical characteristics of the patients ((K) the PCA results for all participants based on seven clinical characteristics; (L) a correlation matrix highlighting the most significant contributing variables for each principal component. The Benjamini and Hochberg adjusted p-values were computed using Dunn’s multiple comparison test [42], which is a post-hoc Kruskal–Wallis test. Note: ns, non-significant; * p < 0.05; ** p < 0.01; *** p < 0.001; **** p < 0.0001; AST, aspartate transaminase; ALT, alanine transaminase; GGT, gamma-glutamyl transferase; HOMA-IR, homeostatic model assessment for insulin resistance; TGs, triglycerides; HC, health control (normal liver); ST, non-alcoholic fatty liver or steatosis; NASH, non-alcoholic steatohepatitis; a.u., arbitrary unit; PC, principal component.

