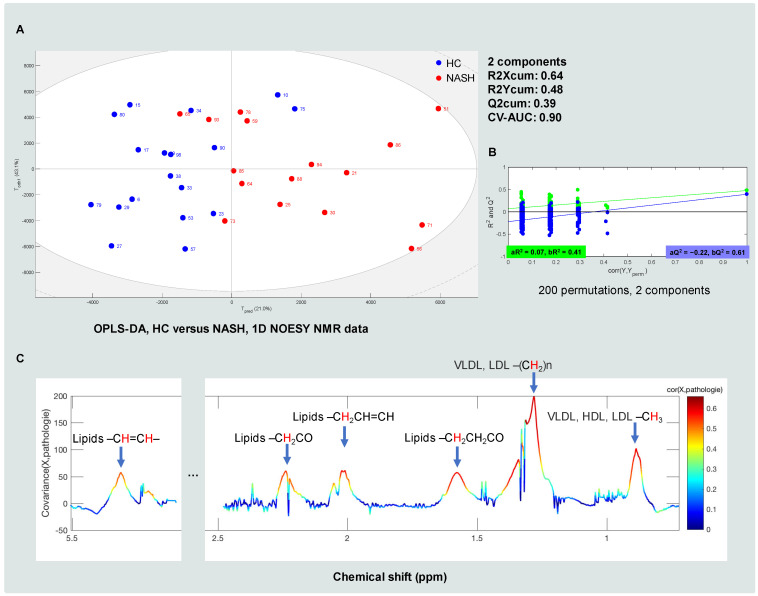
Figure 2.
The NMR-based plasma metabolomics of MAFLD: (A) the OPLS-DA score plot (HC versus NASH; 1D NOESY data); (B) the 200 times permutation test for the OPLS-DA model (HC versus NASH; 1D NOESY data); (C) the OPLS-DA covariance plot (HC versus NASH; 1D NOESY data). The red hydrogen atom indicates the 1H detected by 1H NMR.

