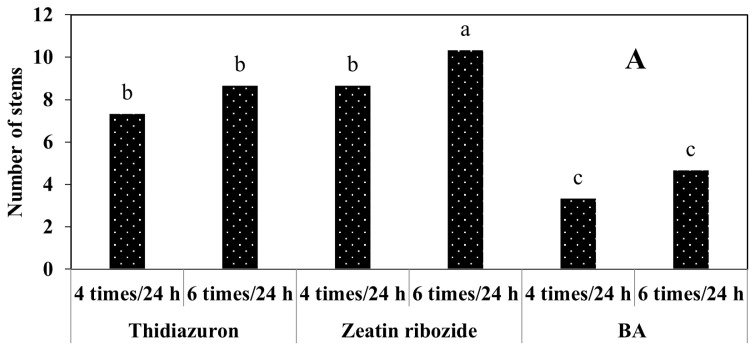
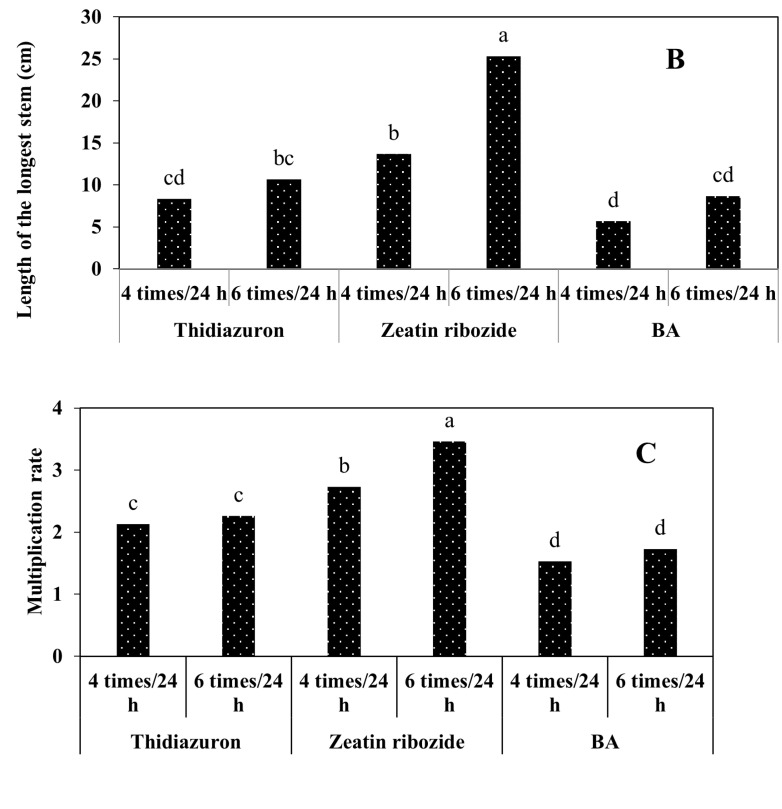
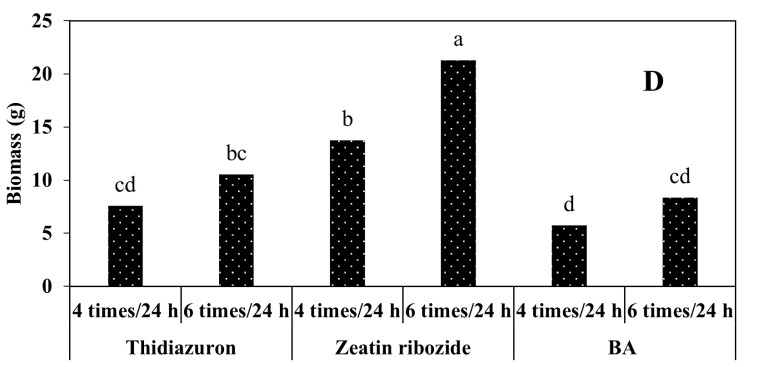
Figure 8.
Mean comparison of the number of stems (A), the length of the longest stem (B), multiplication rate (C), and biomass (D) of S. pennata seedlings under the effect of plant growth hormones and the number of feeding cycles using the temporary immersion bioreactors system. Bars with a common letter do not differ significantly from each other. p < 0.01 probability level (Duncan’s test).


