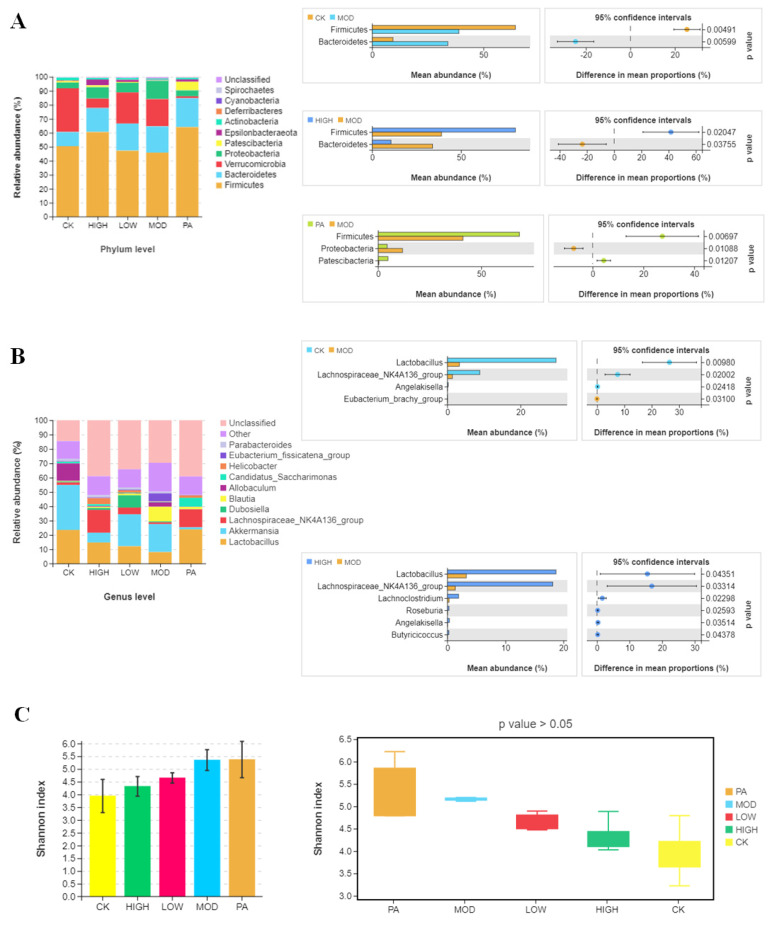
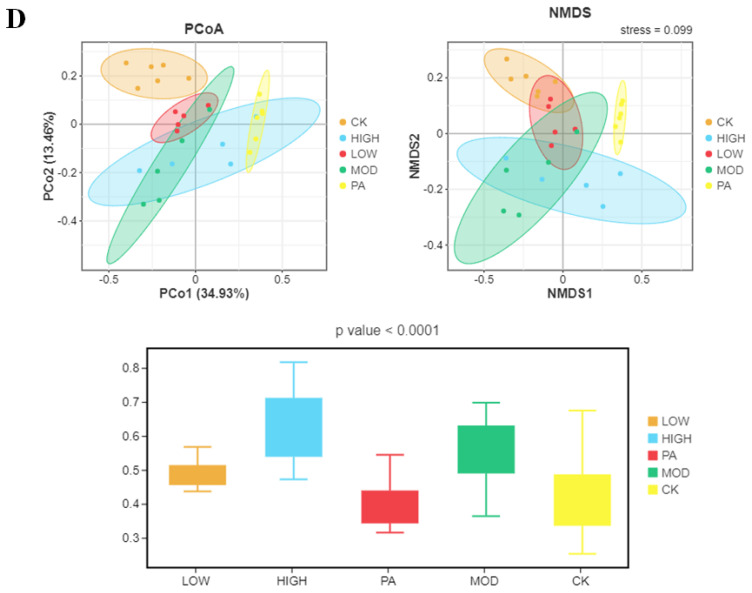
Figure 3.
Gut microbiota diversity. (A) Relative abundance of the cecal microbiota on the phylum level and mean abundance of marker species in each group. The p values are based on Welch’s t test. (B) Relative abundance of the cecal microbiota on the genus level and mean abundance of marker species in each group. The p values are based on Welch’s t test. (C) The α-diversity analysis and Shannon diversity index. The p values are based on Kruskal–Wallis. (D) Effects of NAOs on β-diversity of intestinal microbes. PCoA and NMDS score plots based on Bray (OTU) (p < 0.0001).


