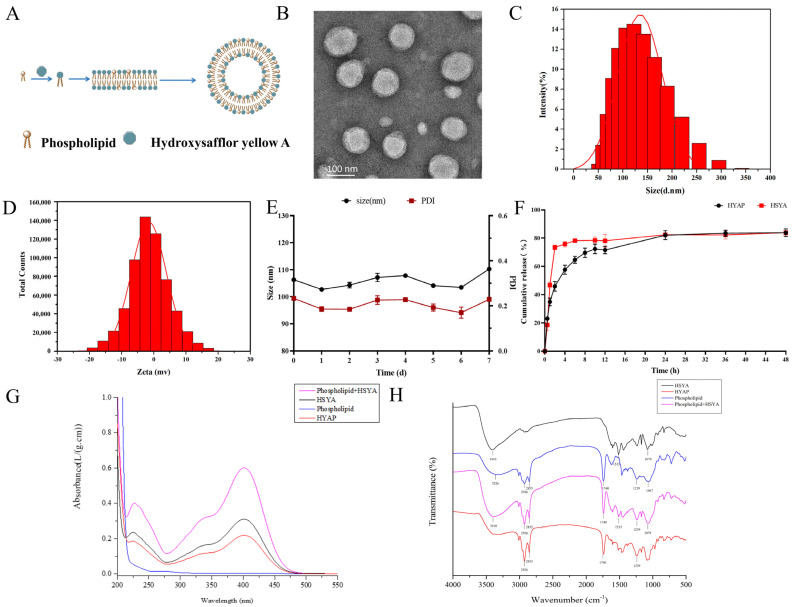
Figure 1.
Preparation and characterization of HYAP. (A) Schematic diagram of the preparation of HYAP. (B) Morphology of HYAP by TEM. Scale bar: 100 nm. (C) Size distribution of HYAP by DLS. (D) Zeta-potential of HYAP. (E) Size and PDI changes of HYAP in seven days. (F) Cumulative release rate of HYAP and HSYA in vitro by UV. (G) Ultraviolet spectroscopy analysis of HSYA, phospholipids, mixture of HSYA and phospholipids, and HYAP. (H) Fourier transform infrared spectroscopy analysis of HSYA, phospholipids, mixture of HSYA and phospholipids, and HYAP.

