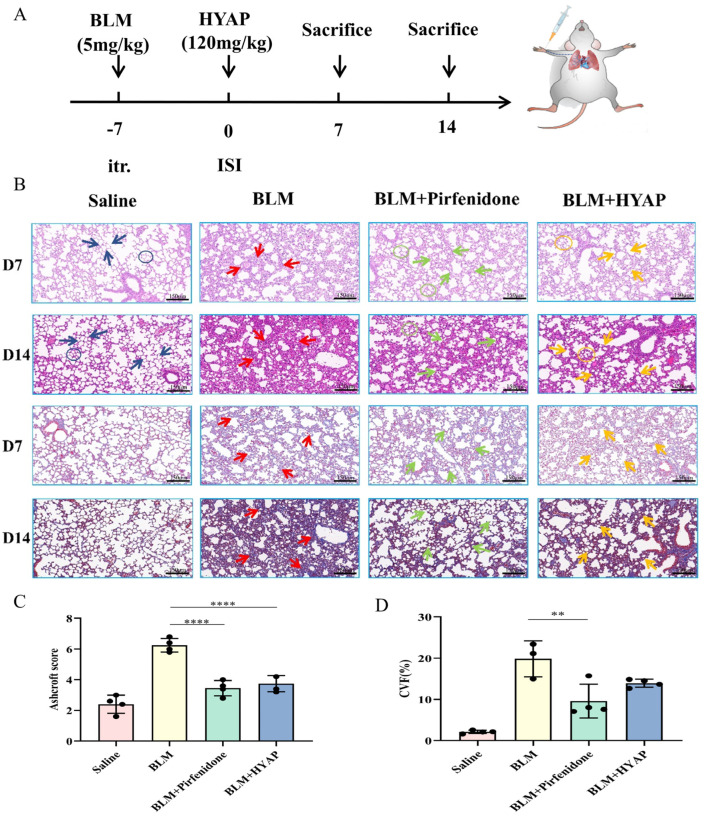
Figure 2.
Histomorphological changes in the lungs of treated mice. (A) Schematic diagram of model establishment and treatment. (B) HE (top) and Masson trichrome staining (bottom) of lung tissue after different treatments (n = 4). Blue arrows indicate the interval between normal pulmonary alveoli in the saline group, and blue circles indicate intact structure of pulmonary alveoli. Red arrows indicate the interalveolar septa in the BLM group that were significantly thickened, and blue collagen fibers were significantly more abundant. Green arrows indicate that the number of interalveolar septa reduced, and collagen deposition decreased in the BLM + pirfenidone group. The green circle indicates that the structure of pulmonary alveoli was restored. Yellow arrows indicate that the number of interalveolar septa was also significantly reduced in mice treated with HYAP, with a concomitant decrease in collagen deposition. Yellow circles indicate the intact structures of pulmonary alveoli. Scale bar: 150 μm. (C) HE staining in different groups after 14 days of treatment was evaluated using the Ashcroft scoring method (n = 4). The BLM group vs. the BLM + pirfenidone group, **** p < 0.0001, and the BLM group vs. the BLM + HYAP group, **** p < 0.0001. (D) The fraction of collagen volume of Masson trichrome staining after 14 days of treatment was calculated using Image J software (n = 4). The BLM group vs. the BLM + pirfenidone group, ** p < 0.01.

