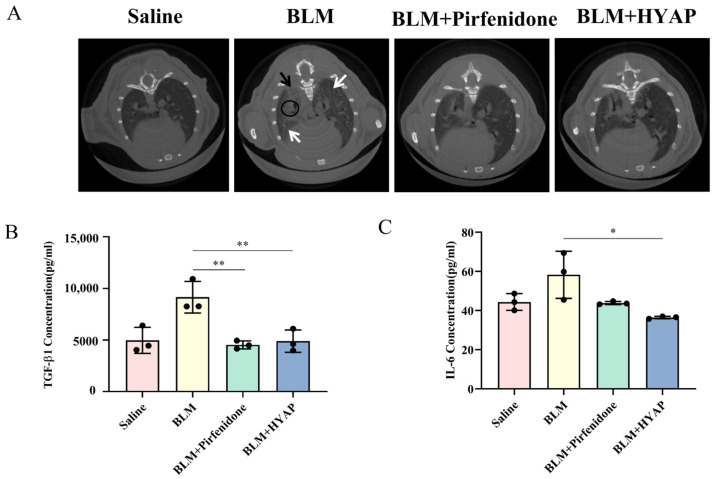
Figure 3.
Micro-CT imaging analysis and secretion levels of inflammatory factors in treated mice after 14 days of treatment. (A) CT imaging of mice after treatments (n = 3). Black circles indicate a large number of high-density shadows that replaced the original lung parenchyma. White arrows indicate ground glass shadows. Black arrows indicate honeycomb shadows. (B,C) Secretion levels of TGF-β1 and IL-6 in mice plasma after treatments were determined using ELISA (n = 3). ** p < 0.01, * p < 0.05.

