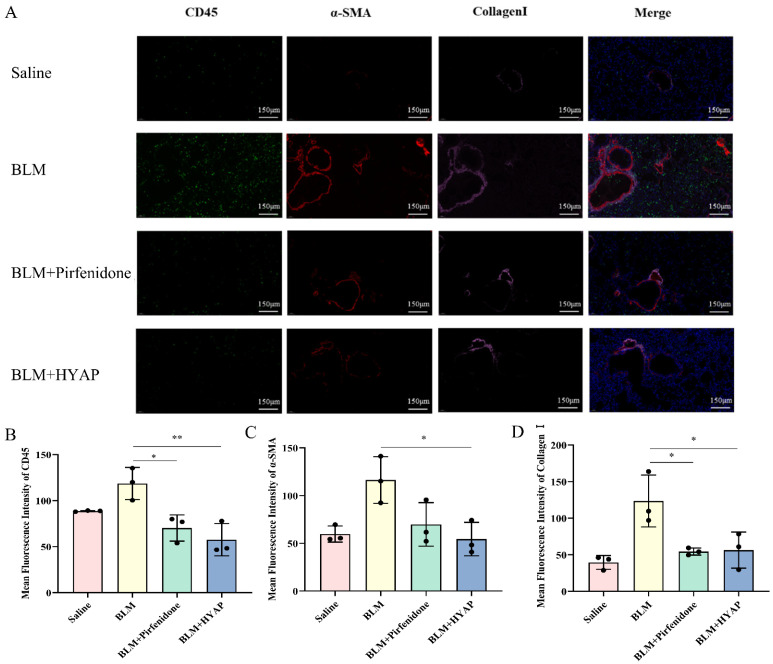
Figure 4.
Immunofluorescence staining showing inflammatory infiltrates and fibroblast activation. (A) Immunofluorescence assay for CD45 (green), α-SMA (red), and collagen I (pink) expression in lungs (n = 3). Scale bar: 150 μm. (B–D) Expression of CD45, α-SMA, and collagen I in lungs after different treatments (n = 3). Fluorescence intensity was analyzed with Image J software. ** p < 0.01, * p < 0.05.

