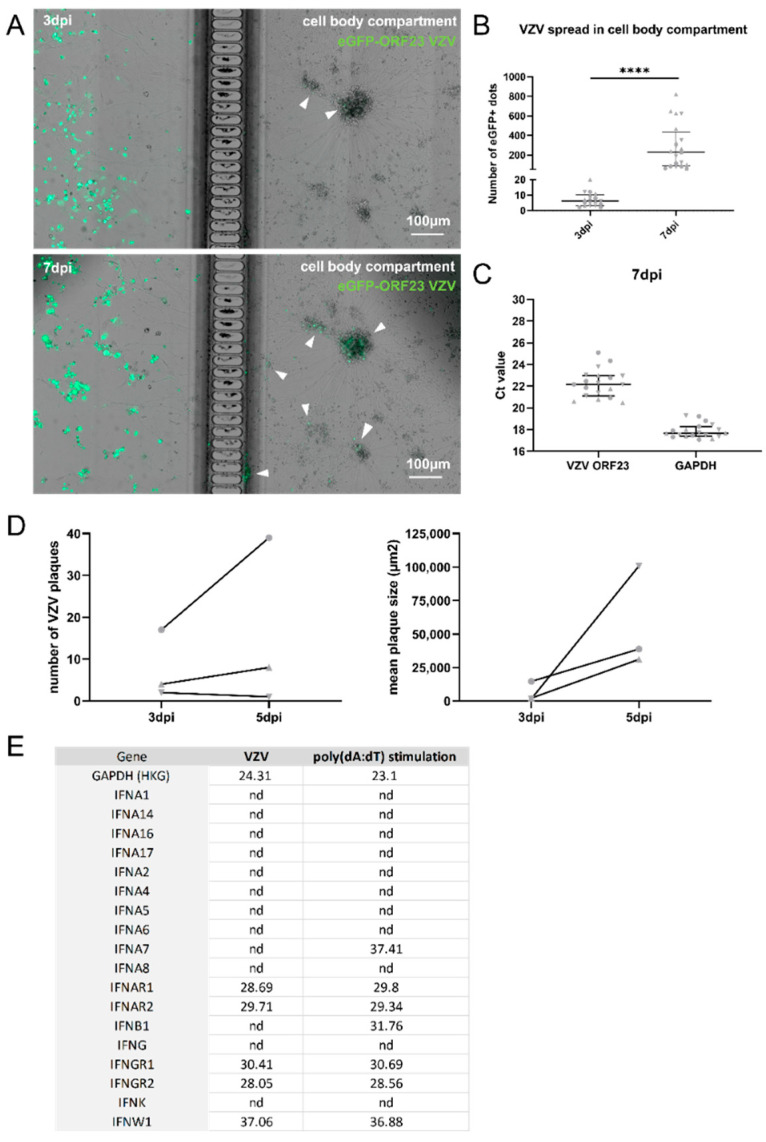
Figure 3.
VZV infection of and spreading in neuronal cultures does not trigger type I IFN production. (A) Representative images of sections of neuronal cultures at 3 dpi (upper panel) and 7 dpi (lower panel) inoculated at their axon termini with 7.3 × 10³ PFU ARPE-19-associated eGFP-ORF23 VZV. Arrow heads indicate eGFP+ dots in the neuronal cell body compartment arising from VZV ORF23 expression. (B) Quantification of the number of eGFP+ dots arising from VZV ORF23 expression in the cell body compartment at 3 dpi and 7 dpi. Median number of eGFP+ dots across experiments at 3 dpi: 6 and at 7 dpi: 231. Each symbol represents the number of eGFP+ dots in the cell body compartment of a single culture originating from one of three independent biological repeats (3 dpi: Experiment 1: circles, n = 6; Experiment 2: triangles, n = 7, Experiment 3: upside down triangles, n = 5; 7 dpi: Experiment 1: circles, n = 6, Experiment 2: triangles n = 8, Experiment 3: upside down triangles, n = 5). Lines with whiskers indicate the median with interquartile ranges from the three independent experiments combined. The p values reported were obtained from a Linear Mixed Model that was adjusted for multiple testing using Dunnett’s comparisons with control test. (C) Ct values for VZV ORF23 and hGAPDH mRNA transcripts. Each symbol represents the Ct value of a single culture originating from one of three independent biological repeats (Experiment 1: circles, n = 7, Experiment 2: triangles n = 7, Experiment 3: upside down triangles, n = 5). Lines with whiskers indicate the median with interquartile ranges from the three independent experiments combined. (D) Quantification of the number of VZV plaques (left) and mean plaque size (right) upon inoculation of ARPE-19 cells with VZV-infected neuronal cell bodies at 3 dpi and 5 dpi. Data are obtained from three independent repeats (Experiment 1: circles, n = 1, Experiment 2: triangles n = 1, Experiment 3: upside down triangles, n = 1). (E) Ct values for type I and II IFNs and receptors are shown. Data are obtained from a pooled sample originating from three independent biological repeats. **** p < 0.0001, nd: not detected.

