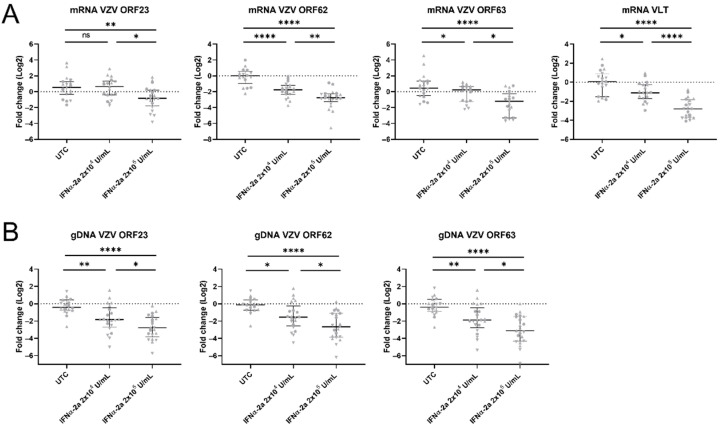
Figure 7.
IFNα reduces VZV transcript expression and VZV genome replication. (A) Relative quantification of mRNA transcripts in the cell body compartment at 7 dpi by RTqPCR. Transcript expression (log2) was set out relative to the mean of the untreated control group (UTC), i.e., fold change. Each symbol represents the log2 fold change of a single culture originating from one of three independent biological repeats (Experiment 1: circles, ORF23 n = 7/7/7, ORF62 n = 7/7/7, ORF63 n = 7/7/7, VLT n = 7/7/7; Experiment 2: triangles, ORF23 n = 7/8/7, ORF62 n = 7/8/8, ORF63 n = 7/6/7, VLT n = 7/8/7; Experiment 3: upside down triangles, ORF23 n = 5/4/6 ORF62 n = 3/5/5, ORF63 n = 5/3/5, VLT n = 5/4/6). Lines with whiskers indicate the median with interquartile range from the three independent experiments combined. The p values reported were obtained from a Linear Mixed Model that was adjusted for multiple testing using Tukey HSD all-pairwise comparison test. (B) Relative quantification of gDNA copies in the cell body compartment at 7 dpi by qPCR. The number of gDNA copies (log2) was set out relative to the mean of the untreated control group (UTC), i.e., fold change. Each symbol represents the log2 fold change of a single culture originating from one of three independent biological repeats (Experiment 1: circles, ORF23 n = 6/7/7, ORF62 n = 5/7/7, ORF63 n = 6/7/7; Experiment 2: triangles, ORF23 n = 7/8/8, ORF62 n= 7/8/8, ORF63 n = 7/8/8; Experiment 3: upside down triangles, ORF23 n = 6/6/6, ORF62 n = 6/6/6, ORF63 n = 6/6/6). Lines with whiskers indicate the median with interquartile range from the three independent experiments combined. The p values reported were obtained from a Linear Mixed Model that was adjusted for multiple testing using Tukey HSD all-pairwise comparison test. * p < 0.05, ** p < 0.01, **** p < 0.0001. ns: not significant.

