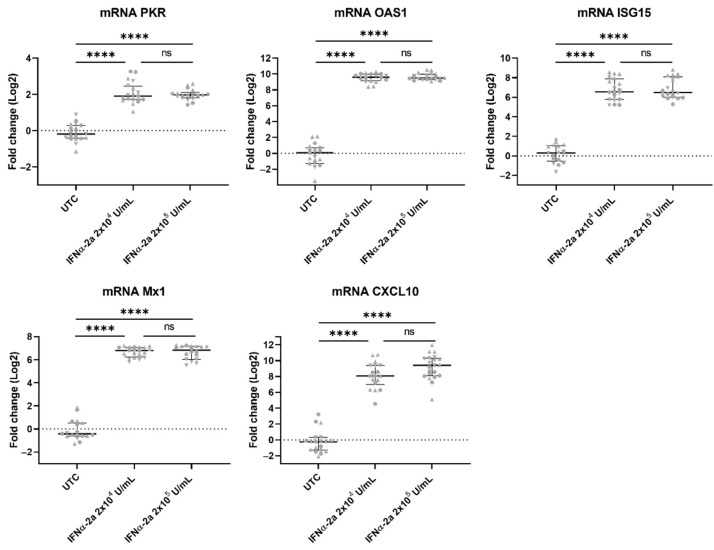
Figure 8.
ISGs are upregulated in VZV-infected hiPSC neurons that are treated with IFNα. Neuronal cell body lysates were harvested at 7 dpi and analyzed by RTqPCR. Transcript expression (log2) was set out relative to the mean of the untreated control group (UTC), i.e., fold change. Each symbol represents the log2 fold change of a single culture originating from one of three independent biological repeats (Experiment 1: circles, PKR n = 7/7/6, OAS1 n = 7/7/7, ISG15 n = 6/7/7, Mx1 n = 7/7/7, CXCL10 n = 7/7/7; Experiment 2: triangles, PKR n = 7/8/7, OAS1 n = 8/8/8, ISG15 n = 7/8/7, Mx1 n = 8/8/6, CXCL10 n = 7/8/8; Experiment 3: upside down triangles, PKR n = 5/5/5, OAS1 n = 4/5/5, ISG15 n = 4/5/6, Mx1 n = 4/5/5, CXCL10 n = 5/3/6). Lines with whiskers indicate the median with interquartile range from the three independent experiments combined. The p values reported were obtained from a Linear Mixed Model that was adjusted for multiple testing using Tukey HSD all-pairwise comparison test. **** p < 0.0001. ns: not significant.

