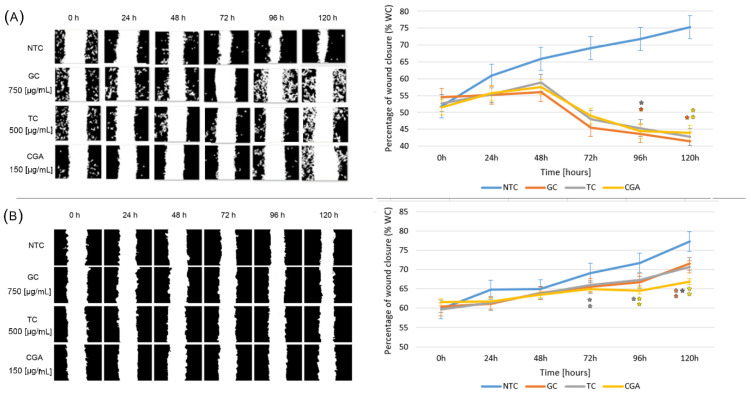
Figure 3.
The inhibition of cellular migration on SW480 (A) and HT-29 (B) cell lines non-treated (blue) and treated with GC (orange), TC (grey), and CGA (yellow). Cell migration was observed with an inverted microscope (10× magnification) at intervals of 24 h over 120 h. Representative images are on the left panel. The right panel shows the quantitative analysis of cell migration by the percentage of wound closure. Values are expressed as the mean ± SEM of three independent experiments. Two-way ANOVA, difference to non-treated cells, * p ≤ 0.05 and ** p ≤ 0.01.

