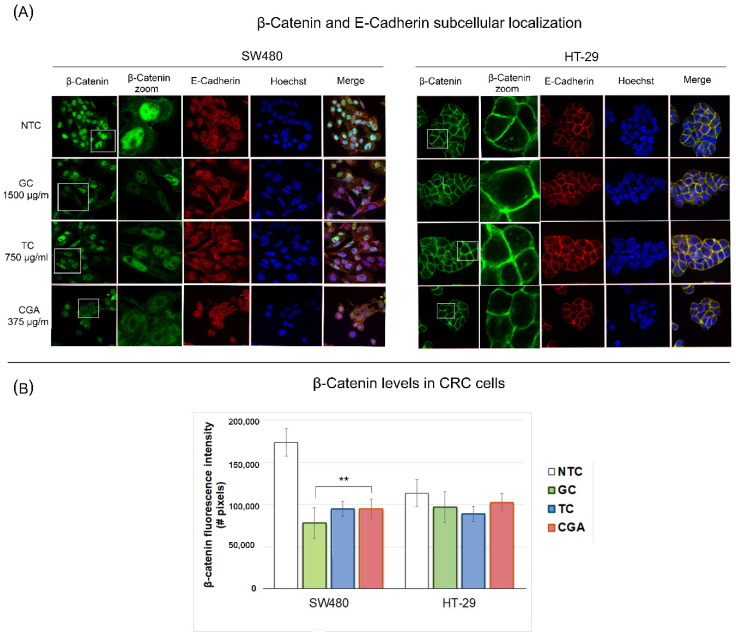
Figure 7.
Subcellular localization of β-catenin (green) and E-cadherin (red) proteins in SW480 and HT29 cells treated with chlorogenic acid (CGA), roasted coffee (TC), and green coffee (GC) at 24 h. The panel (A) includes representative images, and the (B) panel is the β-catenin protein fluorescence intensity in both treated cell lines. The images were captured through an Olympus FV1000 confocal laser scanner microscope with a 60x objective and image scale of 150 µm. Values are expressed as the mean ± SEM of three independent experiments. Two-way ANOVA, difference to non-treated cells, ** p ≤ 0.01; # = number.

