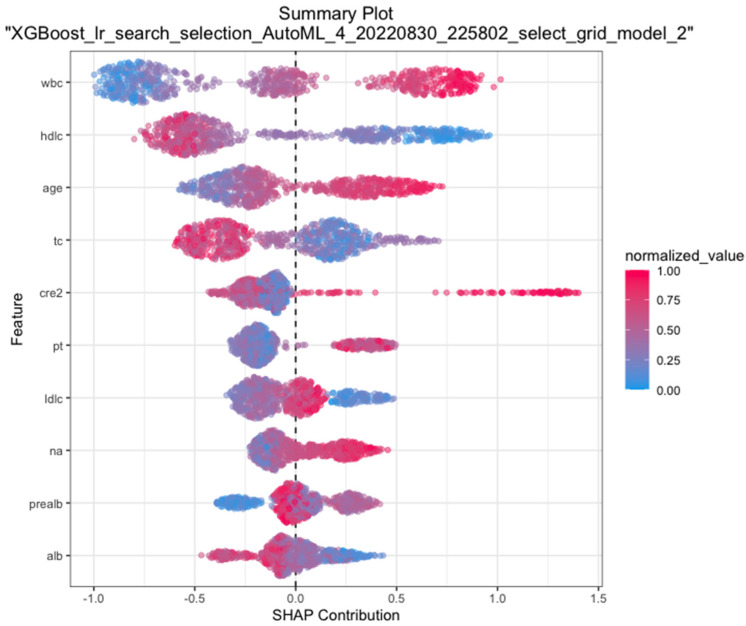
Figure 3.
SHAP plotting of the XGBoost model. The closer the variable value is to 1.5 at the x-axis, the higher the possibility of mortality at 30-day. Abbreviations: wbc, white blood cell count; hdlc, high-density lipoprotein cholesterol; tc, total cholesterol; cre2, creatinine; pt, prothrombin time; ldlc, low-density lipoprotein cholesterol; na, blood sodium; pre-alb, pre-albumin; alb, albumin; SHAP, SHapley additive explanation.

