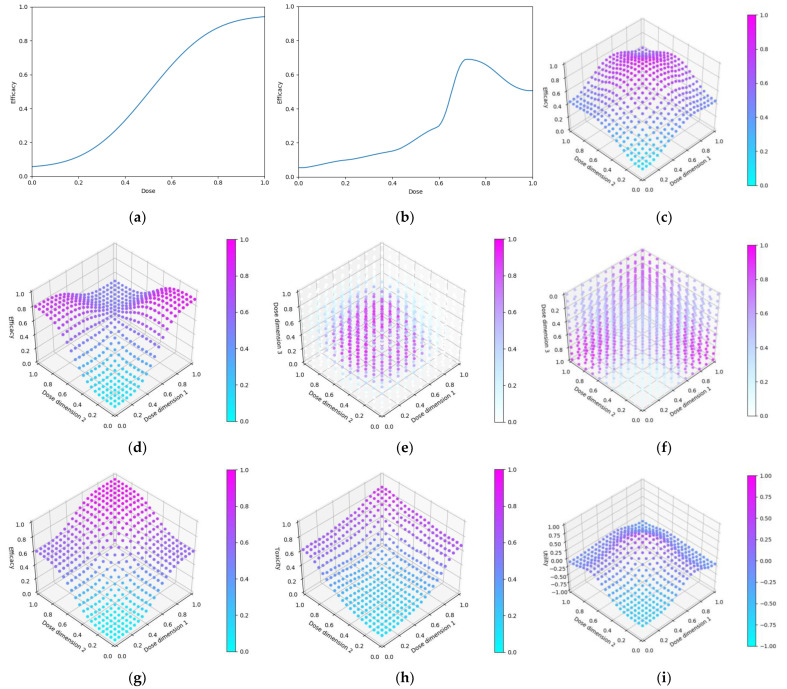
Figure 9.
Dose efficacy and efficacy/toxicity/utility plots for the seven objective 4 scenarios. Dose-efficacy plots were (a) scenario 1, (b) scenario 2, (c) scenario 3, (d) scenario 4, (e) scenario 5, (f) scenario 6. For (g–i) scenario 7, these were, respectively, for efficacy/toxicity/utility. (a,b) The blue line represents the probability of efficacious/toxic response and utility for each dose. (c–i) Purple represents areas of higher efficacy/toxicity/utility.

