Figure 3.
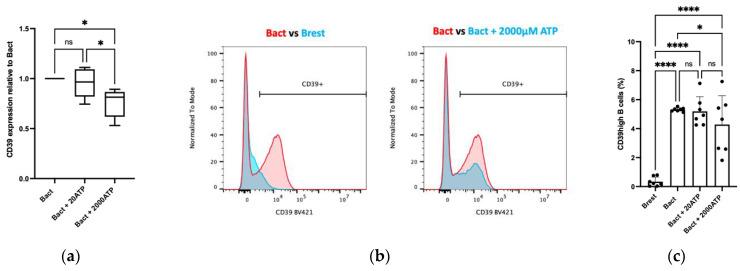
Flow cytometry data of CD39 expression on B cells in the presence of ATP (20 µM vs. 2000 µM). (a) Box plot graph illustrates the relative overall CD39 expression in activated B cells (Bact) and in the presence of ATP. The mean of six independent experiments with standard deviation is presented. The mean of each ATP intervention is related to Bact (value 1). The presence of 2000 µM ATP significantly decreased the CD39 expression in Bact. Bact vs. Bact + 2000 µM ATP: p * = 0.014; Bact + 20 µM ATP vs. Bact + 2000 µM ATP: p * = 0.012; ns = not significant: p > 0.05. (b) Activated B cells (Bact, red) showed a higher CD39 expression than resting B cells (Brest, blue). Bact with 2000 µM ATP (blue) showed a decreased CD39 expression. BV421 = Brilliant Violet 421. (c) Scatter dot bar charts of CD39high B cells (in %) after activation and in the presence of ATP. The mean of six independent experiments with standard deviation is presented. Activation of B cells increased the CD39high B-cell rate with high significance. Addition of 20 µM ATP did not impact the rate of CD39high B cells. The amount of 2000 µM ATP significantly decreased the rate of CD39high B cells. Brest vs. Bact: p **** < 0.0001; Brest vs. Bact + 20 µM ATP: p **** < 0.0001; Brest vs. Bact + 2000 µM ATP: p **** < 0.0001; Bact vs. Bact + 2000 µM ATP: p * = 0.047; ns = not significant: p > 0.05. Statistical significance was determined using a one-way ANOVA approach with multiple comparisons by controlling the false discovery rate.

