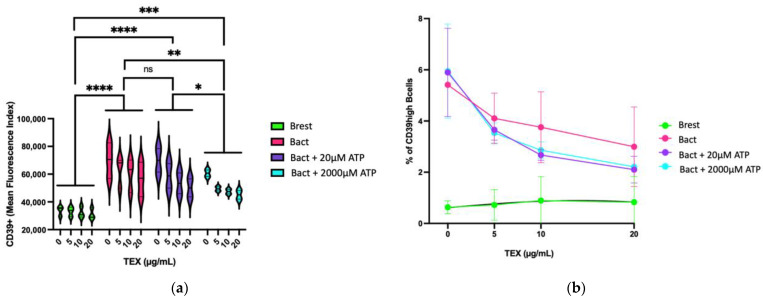
Figure 4.
Flow cytometry data showing the dose-dependent influence of TEX on CD39 expression levels in activated B cells (Bact) or resting B cells (Brest) with 0, 20, or 2000 µM ATP added. (a) The graph shows the CD39 mean fluorescence index of the four groups. With high significance, activation of B cells increased the overall CD39 expression on B cells as compared to Brest (p **** < 0.0001). Further addition of 2000 µM ATP but not 20 µM ATP significantly reduced CD39 expression on Bact (p ** = 0.0026). The influence of TEX within the individual groups indicated a trend toward reduced CD39 expression on B cells, especially in Bact. No change was seen in Brest. In Bact + 2000ATP co-incubated with the highest TEX concentration (20 µg/mL), CD39 expression approximated the range seen in Brest. Brest vs. Bact + 20 µM ATP: p **** < 0.0001; Brest vs. Bact + 2000 µM ATP: p *** = 0.0001; Bact + 20 µM ATP vs. Bact + 2000 µM ATP: p * = 0.0249; ns = not significant: p > 0.05. Statistical significance was calculated using a Holm–Sidak multiple comparisons test. (b) Dose titration curve of B cells with TEX measured by surface CD39 expression. The graph illustrates the dose-dependent reduction in CD39high B cells through TEX which is enhanced through ATP. At 20 µg/mL TEX, the CD39high rate in Bact with or without ATP dropped to almost the range measured in Brest. At this point, the difference between each Bact setting and Brest lost its significant value. With 0 µg/mL TEX: Brest vs. Bact: p *** = 0.0003; Brest vs. Bact + 20 µM ATP: p **** < 0.0001; Brest vs. Bact + 20 µM ATP p **** < 0.0001. With 5 µg/mL TEX: Brest vs. Bact: p *** = 0.0023; Brest vs. Bact + 20 µM ATP: p * = 0.0237; Brest vs. Bact + 20 µM ATP p * = 0.0323. With 10 µg/mL TEX: Brest vs. Bact: p *** = 0.0067. Statistical significance was calculated using a three-way ANOVA approach with Dunnett’s multiple comparisons test. The results of three independent experiments are presented.

