Figure 6.
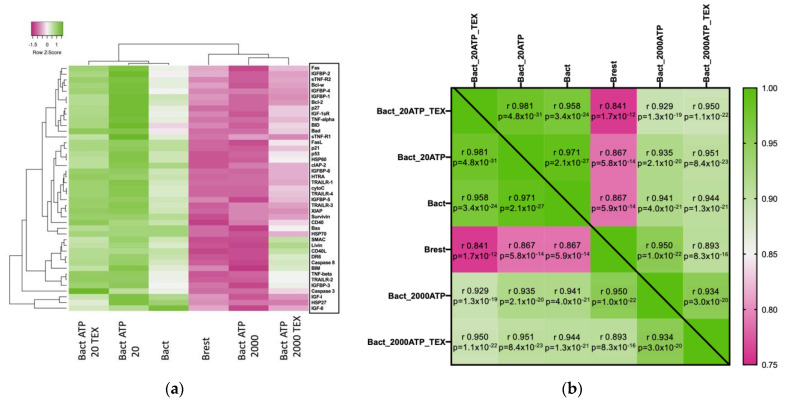
Heatmaps showing the protein expression of 43 different pro- and anti-apoptotic proteins of four independent experiments with isolated B cells in six different conditions (Brest: resting B cells; Bact: activated B cells; Bact with 20 µM or 2000 µM ATP; and Bact with 20 µM or 2000 µM ATP and TEX). (a) Unsupervised heatmap with the B cells in the six conditions on the x-axis and the 43 proteins on the y-axis. Unsupervised clustering uncovered two groups: the green-dominated group (Bact and Bact with 20 µM ATP with or without TEX) and the pink-dominated group (Brest and Bact with 2000 µM ATP with or without TEX). Distance measuring method: Pearson. Clustering method: average linkage. (b) Heatmap showing the protein expression as an overall mean. Differences between each group were highly significant. The most pronounced differences were between Brest and Bact or Bact + 20 µM ATP +/− TEX. Pearson correlation matrix with respective r-values (scale 0.75–1.00) and statistical significances (p-values).

