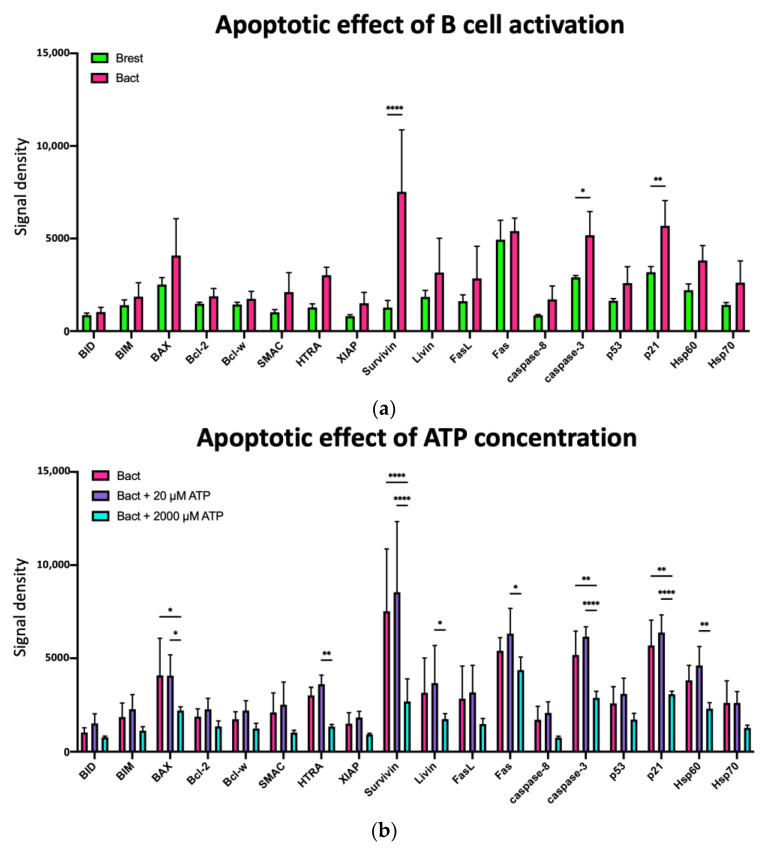
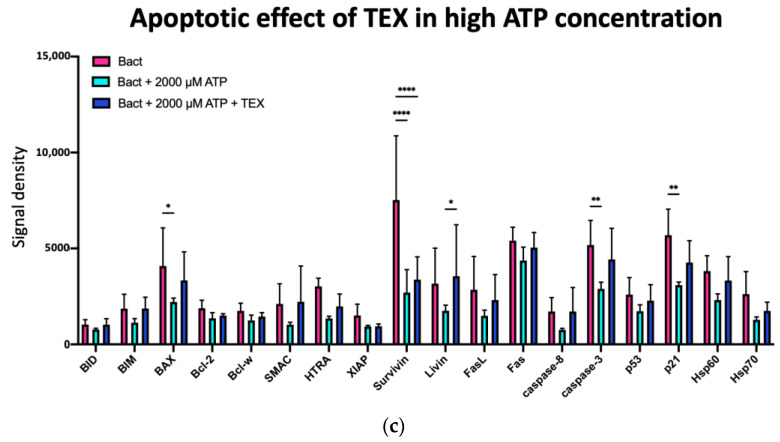
Figure 7.
Bar charts comparing the expression of 18 selected apoptosis-associated proteins shown in Figure 6a. (a) Activated B cells (Bact) with a nonsignificant upregulation in 15 proteins compared to resting B cells (Brest). Significant upregulation for Survivin (p **** < 0.0001), Caspase 3 (p * = 0.0215), and p21 (p **= 0.0068). Significance determined by two-way ANOVA with Šídák’s multiple comparisons test. (b) Addition of 20 µM ATP to activated B cells (Bact) with nonsignificant impact on the expression of the selected 18 apoptosis-associated proteins. Addition of 2000 µM ATP to Bact with downregulation of all 18 of the pro- and anti-apoptotic proteins. Significant downregulation for B (Bact vs. Bact + 2000 µM ATP: p * = 0.0367; Bact + 20 µM ATP vs. Bact + 2000 µM ATP: p * = 0.0378), HTRA (Bact + 20 µM ATP vs. Bact + 2000 µM ATP: p ** = 0.0085), Survivin (Bact vs. Bact + 2000 ATP: p **** < 0.0001; Bact + 20 µM ATP vs. Bact + 2000 µM ATP: p **** < 0.0001), Livin (Bact + 20 µM ATP vs. Bact + 2000 µM ATP: p * = 0.0310), Fas (Bact + 20 µM ATP vs. Bact + 2000 µM ATP: p * = 0.0264), Caspase 3 (Bact vs. Bact + 2000 ATP: p ** = 0.0074; Bact + 20 µM ATP vs. Bact + 2000 µM ATP: p **** < 0.0001), p21 (Bact vs. Bact + 2000 ATP: p ** = 0.0018; Bact + 20 µM ATP vs. Bact + 2000 µM ATP: p **** < 0.0001), and Hsp60 (Bact + 20 µM ATP vs. Bact + 2000 µM ATP: p ** = 0.0068). Significance determined by two-way ANOVA with Tukey’s multiple comparisons test. (c) Addition of TEX to activated B cells (Bact) with 2000 µM ATP with a nonsignificant upregulation in 16 of the 18 apoptotic proteins. Significant upregulation for Survivin (Bact + 2000 µM ATP vs. Bact + 2000 µM ATP + TEX: p **** < 0.0001), and Livin (Bact + 2000 µM ATP vs. Bact + 2000 µM ATP + TEX: p * = 0.0362). Significance determined by two-way ANOVA with Tukey’s multiple comparisons test.


