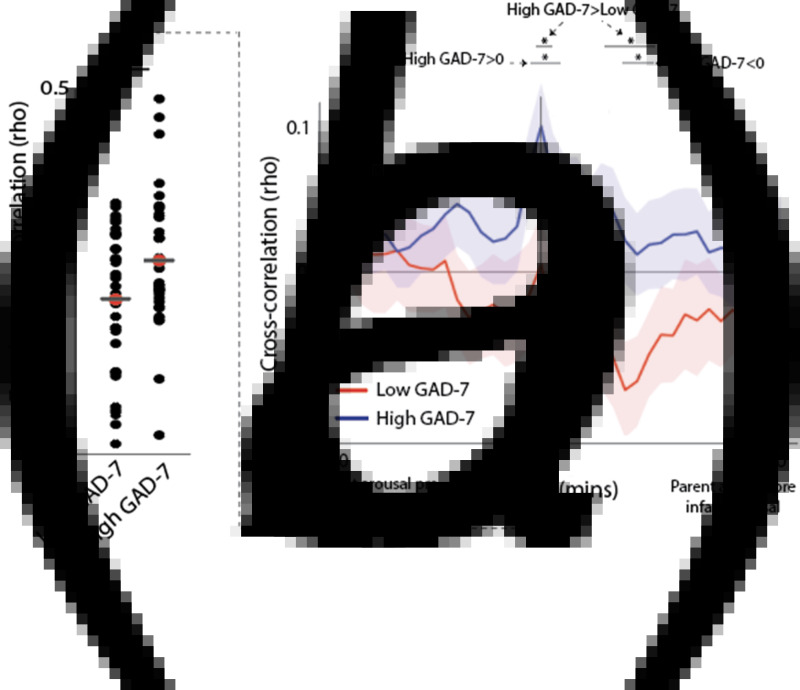
Fig. 3.
(a) Scatterplot showing the zero-lagged cross-correlation between parent and child arousal, subdivided by maternal anxiety (i.e. low and high GAD-7). * indicates the results of the t tests conducted as described in the main text p < 0.05. (b) cross-correlation function between parent and child arousal, subdivided by low and high parental anxiety. The peak at time 0 indicates that when parent and infant arousal synchrony are compared, they significantly associate and this is greater in high anxiety dyads than low anxiety dyads. Shaded areas indicate the standard error of the means. * p < 0.05 following correction for multiple comparisons using permutation-based temporal clustering analyses (see SM section 1.5).

