Fig. 4.
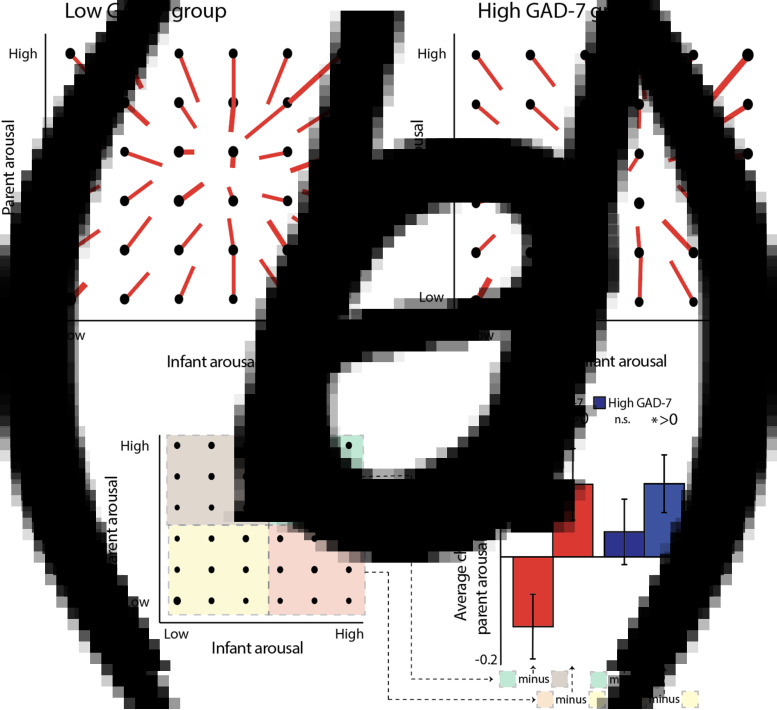
(a)–(b) Vector plot illustrating transitions between arousal bins, contingent on starting arousal state. (a) Shows non-anxious (low GAD-7) group; (b) shows anxious (high GAD-7) group. Data were averaged into 60-s epochs and binned from 1 (low) to 6 (high), for infant and parent separately. Thus, an epoch classified as (1, 1) indicates an epoch in which both infant and parent were in a low arousal state. The red line indicates the average direction of travel between that and the subsequent epoch, averaged across all epochs in that bin. Thus, for the position (1, 1) on plot (a), the red line shows a displacement of +0.3 on the x-axis and +0.4 on the y-axis, indicating that the average epoch starting at (1, 1) showed an increase of +0.3 in infant arousal and +0.7 in adult arousal to the subsequent epoch. (c) schematic illustrating the analysis whose results are shown in (d). Each vector plot was divided into four quadrants: Parent low/Infant low (yellow, 1), Parent low/Infant high (red, 2), Parent high/Infant low (brown, 3), and Parent high/Infant high (green, 4). In order to investigate how infant arousal and adult arousal interacted to predict the change in adult arousal, we subtracted the average adult change scores in quadrant 4 from quadrant 3, and quadrant 2 minus quadrant 1. This was performed separately for the two groups. (d) bar chart showing the results of the analysis: when the adult's arousal starts high, their arousal decreases more in instances where the infant's arousal is high, than when it is low (low GAD-7 group only). * indicates the significance of the analyses comparing the observed values to a chance level of 0. *p < 0.05, †p = 0.05.

