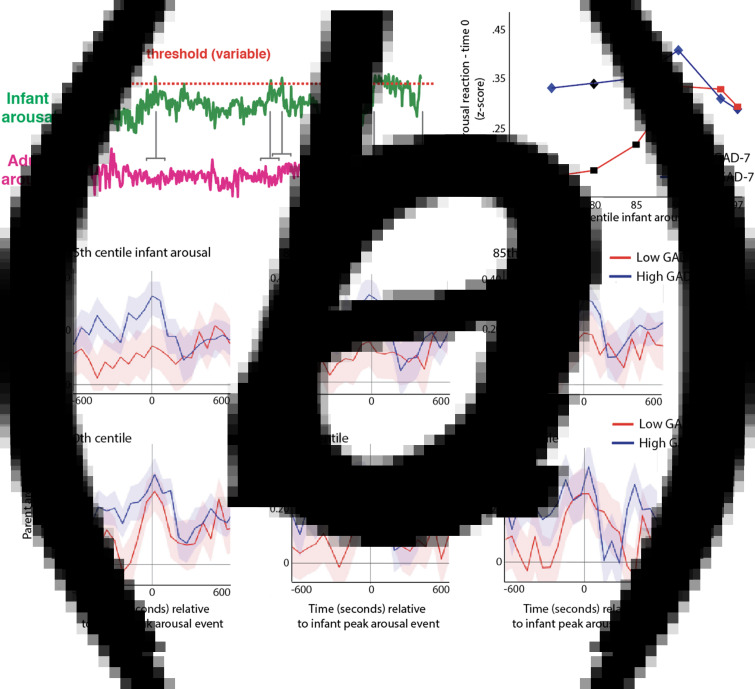
Fig. 5.
(a) Schematic illustrating the analysis shown in (b)–(c). First, adult's arousal data are z-scored, participant by participant. Next, instances where the infant's arousal crosses a centile threshold (e.g. exceeded the 95th centile of samples for that infant in that day) were identified. Then, for each instance, the change in adult arousal from 600 s before to 600 s after the infant peak arousal moment was excerpted. Individual instances were averaged to index how the adult's arousal level changed relative to the ‘peak’ arousal moment of the infant. The analysis was repeated using different values for the centile threshold. (b) Change in parent arousal relative to ‘peak’ arousal moments of the infant, defined using variable centile thresholds. (c) Summary plot showing just the time 0 parent arousal levels from the plots in (b). Both groups showed maternal reactivity to extremes of infant arousal, but high GAD-7 parents showed greater autonomic reactivity to small-scale fluctuations in infant arousal. Where the permutation-based temporal clustering analyses indicated that a significant peak in adult arousal was observed relative to the infant ‘peak’ arousal event, the datapoint has been drawn in colour (blue/red for anxious/non-anxious group, i.e. high/low GAD-7 groups). Where no significant peak in adult arousal was observed, the datapoint has been drawn black. It can be seen that the lower anxiety group only show significant peaks in parent arousal relative to the 3% and 5% most extreme instances of elevated infant arousal; but the higher anxiety group show significant peaks in parent arousal relative to the 25%, 15%, 10%, 5%, and 3% most extreme instances.

