Figure 1.
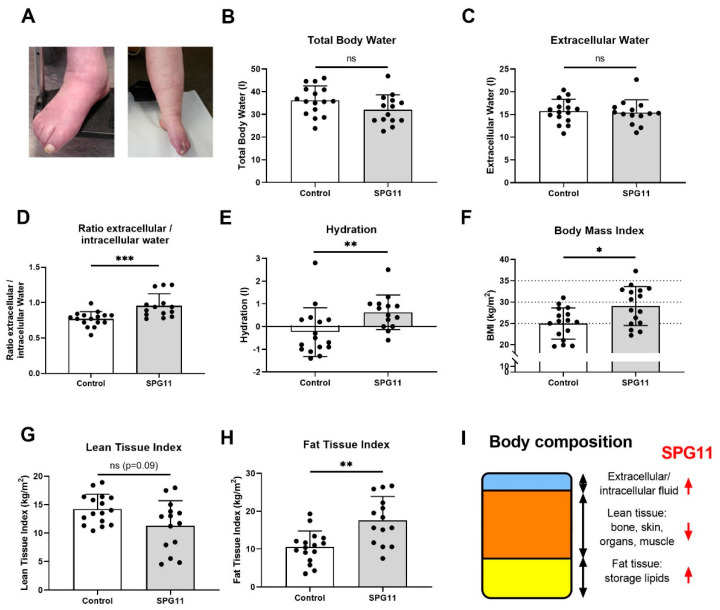
Body composition of SPG11 patients compared to matched healthy controls. (A) Representative lower limb lymphedema of late-stage SPG11 patients. Note the blue-livid discoloration and swelling of the calf and feet. (B–E) Body fluid distribution derived from bioimpedance spectroscopy comprising (B) total body water, (C) extracellular water, (D) the ratio of extracellular and intracellular water, and (E) total hydration state. (F) Body mass index (BMI) was increased in 12 out of 16 SPG11 patients. (G) Lean tissue index was reduced in SPG11 (not at a significant level), whereas (H) fat tissue index showed a significant increase in SPG11. (I) Model of body composition and its changes in SPG11, indicated by red arrows. Bars indicate means ± SD. All groups were compared by Mann–Whitney U tests. ns: not significant, * p < 0.05, ** p < 0.01, *** p < 0.001.

