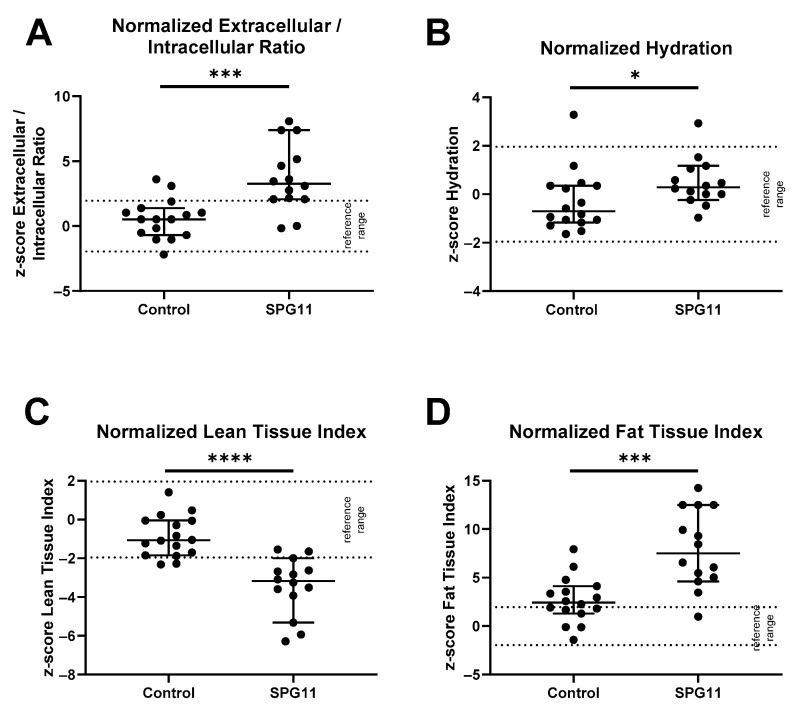
Figure 2.
Normalized body composition values in controls and SPG11. Bioimpedance spectroscopy values in controls and SPG11 shown as Z-scores calculated from previously reported sex- and age-adjusted reference values from 1000 healthy subjects. Reference cutoff values had been defined by the 10th and 90th percentiles and are indicated as dotted lines. When comparing normalized values of SPG11 vs. controls, there was a significant difference in (A) normalized extracellular/intracellular fluid ratio, (B) hydration, (C) lean tissue index, and (D) fat tissue index. * p < 0.05, *** p < 0.001, **** p < 0.0001, based on non-parametric Mann–Whitney U tests.

