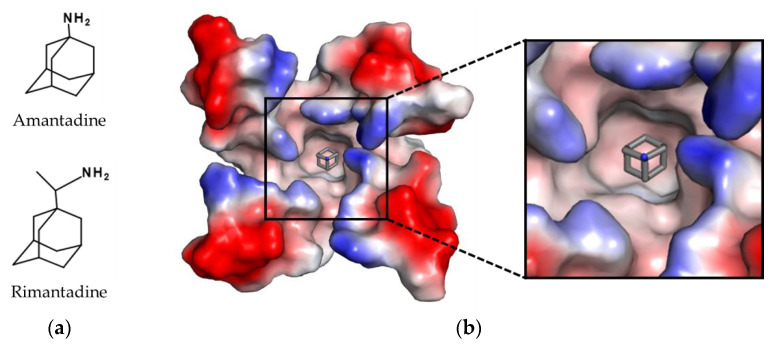
Figure 3.
Structures of approved M2 channel inhibitors. (a) Chemical structure of amantadine and rimantadine. (b) Complex of amantadine (shown as sticks with grey carbon atoms and nitrogen in blue) in the pore of the M2 channel. The surface of the M2 channel was colored according to is calculated negative (−64 kT/e, red) and positive (+64 kT/e, blue) electrostatic potential. The structure was determined by X-ray crystallography (10.2210/pdb3C9J/pdb) [23]. The figure was generated with PyMOL Molecular Graphics System Version 2.0 (Schrödinger, LLC, New York, NY, USA).

