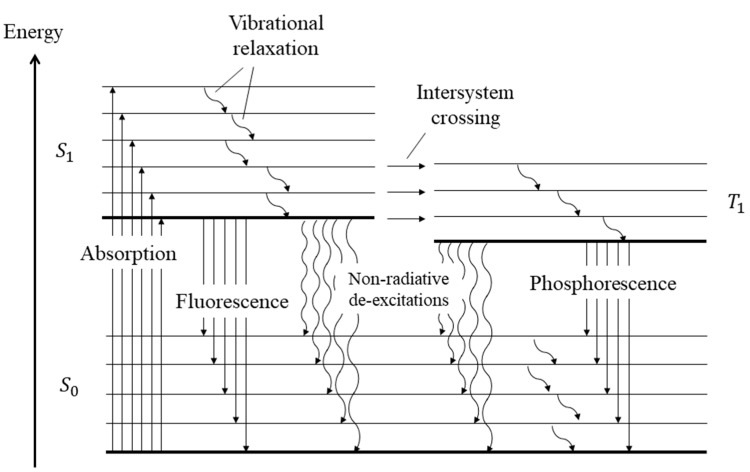
Figure 30.
Jablonski energy-level diagram. The straight lines represent radiative processes, the wavy lines represent non-radiative processes. The non-radiative de-excitations include both internal and external conversions [166]. Reproduced with permission of the author.

