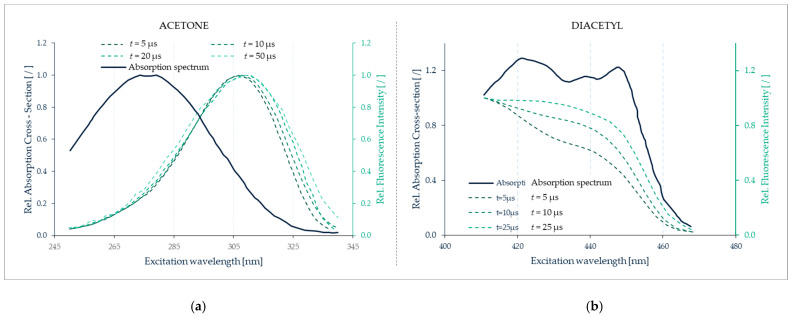
Figure 33.
Absorption (solid black lines) of (a) acetone, obtained by Lozano et al. [171], and (b) of diacetyl, obtained by Stier and Koochesfahani [176] and phosphorescence emission (dashed green lines) intensity of (a) acetone, and (b) diacetyl, as a function of the laser excitation wavelength, obtained by Fratantonio et al. [172]. The signals are normalized by the intensity value for the wavelength of peak emission. (a) Acetone vapor at and ; (b) Diacetyl vapor at and . Data from [172].

