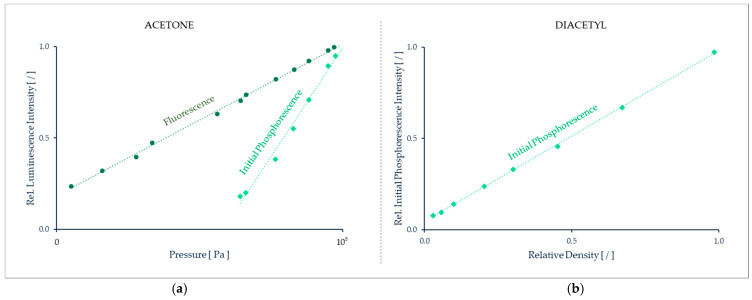
Figure 37.
(a) (◆) Pressure dependence of acetone phosphorescence emission intensity collected for 100 ns < t < 600 ns, normalized by its value at atmospheric pressure for and a molar fraction of acetone of 10.4%; (●) experimental fluorescence intensity collected for 0 < t < 10 ns normalized by its value at atmospheric pressure. Data from Si Hadj Mohand et al. [184]. (b) Density dependence of initial phosphorescence intensity of diacetyl: the ordinate is normalized by the largest initial phosphorescence intensity of each experimental run, and the abscissa is normalized by the highest density of each experimental run. Data from Jian-Bang et al. [182].

