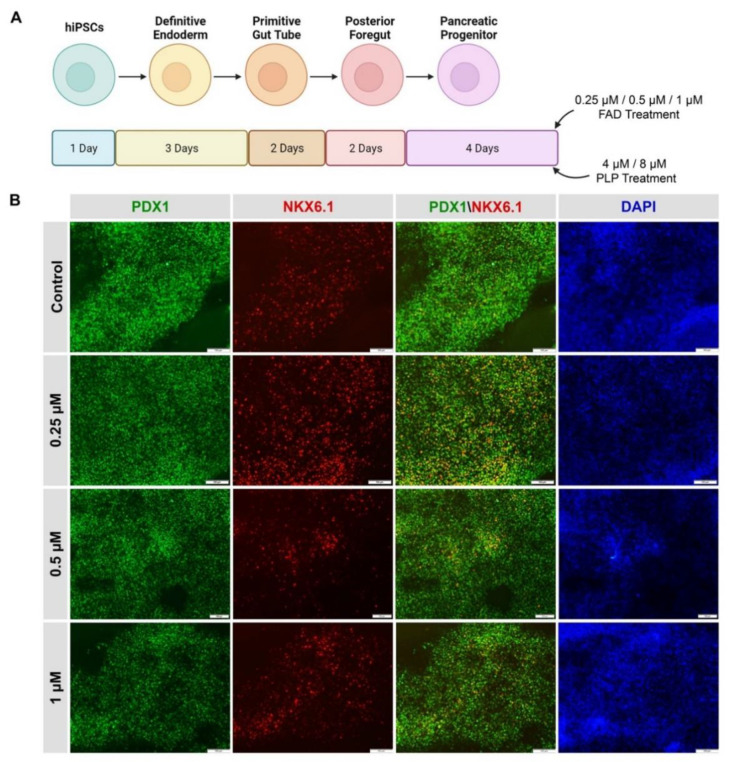
Figure 7.
Differentiation of hiPSCs into pancreatic progenitors in the presence of FAD and PLP. (A) A diagram showing the steps of pancreatic progenitor differentiation and their treatment with FAD or PLP. During stage 4 of differentiation, the cells were treated for 4 days with different concentrations of FAD (0.25 µM, 0.5 µM, and 1.0 µM) or PLP (4 µM and 8 µM) (B) Representative immunostaining images showing the co-expression of PDX1 and NKX6.1 in iPSC-derived pancreatic progenitors after treatment for 4 days with different concentrations of FAD. Scale bars = 100 µm.

