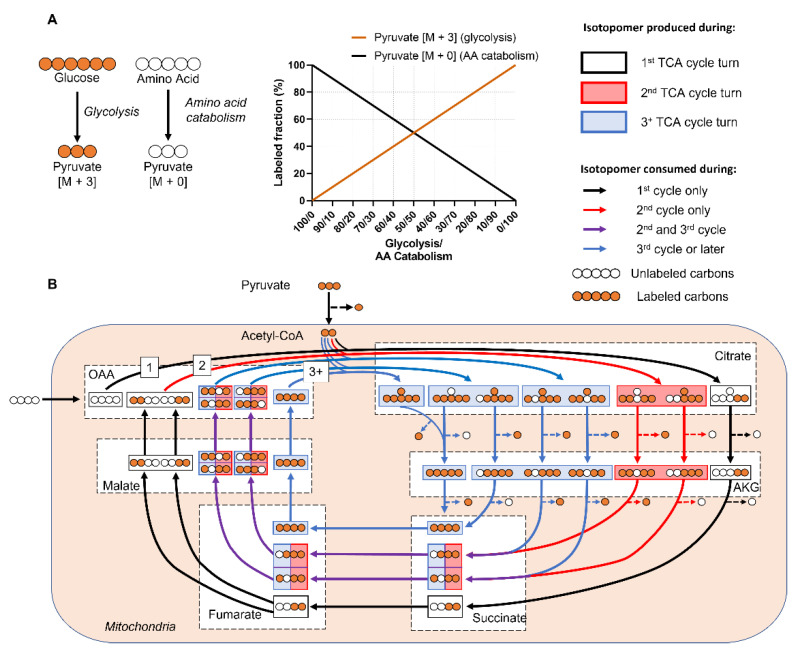
Figure 1.
Labeling patterns from mammalian metabolic networks are complex and difficult to interpret. (A) A simple metabolic network that assumes only two sources for pyruvate: labeled glucose and unlabeled amino acids. The relative fraction of [M+3]/[M+0] pyruvate isotopomers depends on relative activity of glycolysis vs. amino acid catabolism. As glycolytic activity increases, more of the pyruvate pool will be labeled. (B) Cyclic metabolic networks, such as the TCA cycle, generate a different set of isotopomers at each turn. This simplified example assumes a TCA cycle in which uniformly labeled glucose and an unlabeled 4-carbon substrate that feeds into oxaloacetate (OAA) are the only carbon contributors. Each color represents a different turn of the TCA cycle. The anaplerotic source forms the initial OAA backbone that is metabolized with glucose-derived labeled acetyl-CoA to form [M+2] citrate (black arrows). Fumarate and succinate are symmetrical molecules, means the labeled atoms can flip positions. This doubles the number of malate isotopomers generated from partially labeled fumarate (purple arrows) starting from the 2nd turn of the TCA cycle, which ultimately results in additional citrate isotopomers in the subsequent turns of the TCA cycle (blue arrows). Real world examples in which multiple anaplerotic pathways feed into the TCA cycle, as well as reversible reactions, add more complexities. Abbreviations: Citrate (Cit), Alpha-ketoglutarate (AKG), Oxaloacetate (OAA), Fructose-6-phosphate (F6P), Glucose-6-phosphate (G6P), Amino Acid (AA).

