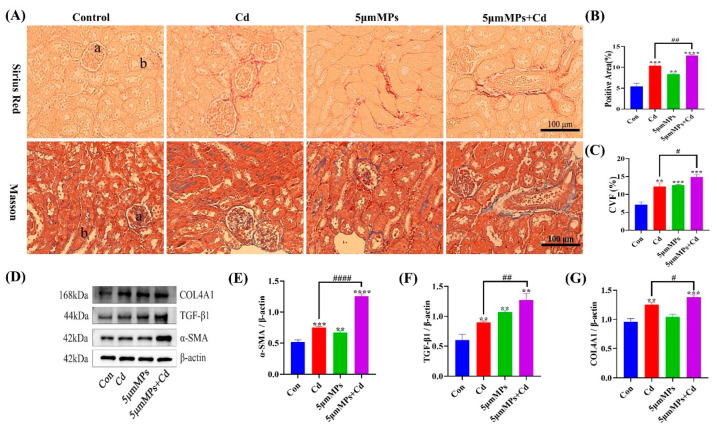
Figure 5.
Effect of MPs and Cd on fibrosis in mouse kidneys. (A–C): Representative images of Sirius Red staining and Masson staining of the kidney after MP and/or Cd exposure. a: Glomerulus, b: Renal tubule. (B,C): Quantitative analysis. (D–G): The levels of collagen type IV alpha 1 chain (COL4A1), transforming growth factor beta 1 (TGF-β1), and alpha smooth muscle actin (α-SMA) were detected using western blotting. (D): Representative western blot image; (E–G): Quantitative analysis. Data are presented as means ± SD from three independent experiments. ** p < 0.01, *** p < 0.001, **** p < 0.0001 compared to the control group; # p < 0.05, ## p < 0.01, #### p < 0.0001 compared to the Cd group.

