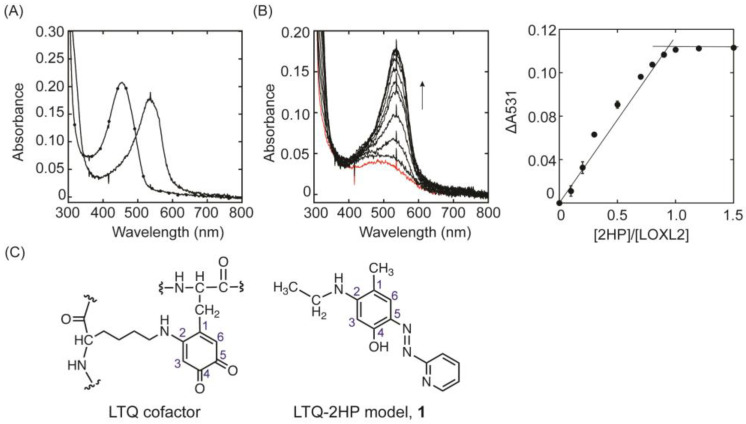
Figure 2.
Inhibition of LOXL2 with 2HP. (A) UV−vis spectra of PH−inhibited LOXL2 (−−−) and 2HP−inhibited LOXL2 (−●−). (B) UV−vis spectroscopic titration of LTQ with 2HP. Increase in absorbance at 531 nm was observed. The UV-vis spectrum of the resting LOXL2 (containing unmodified LTQ) before addition of 2−HP is shown in red (left). The absorbance change at 531 nm (Δ531) was plotted against the molar ratio of [2HP]/[LOXL2]. The increase in absorption at 531 nm was saturated near [2HP]/[LOXL2] = 1.0 (right). The UV−vis spectroscopic titration was done in triplicate and the error bars were generated by Kaleidagraph. The spectral changes were linear up to [2HP]/[LOXL2] = 0.95 and reached a plateau at ≥ [2HP]/[LOXL2] = 1.0. (C) Structures of the LTQ cofactor (left) and LTQ−2HP model compound, 1 (right). A numbering system of carbons of the LTQ cofactor in the enzyme [4] is applied to the model compound, 1.

