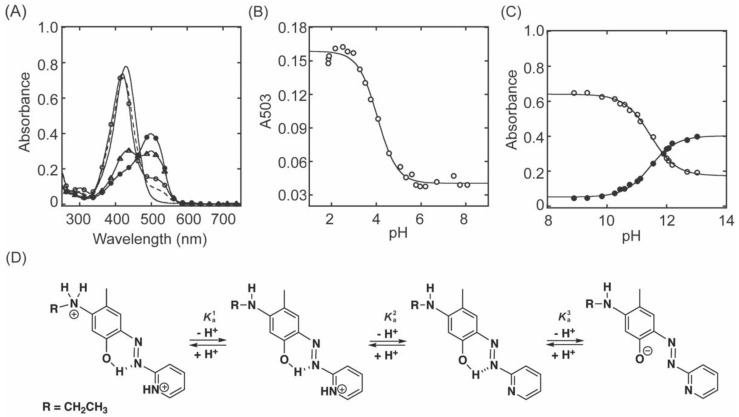
Figure 3.
UV−vis spectroscopic titration of pKas of 1. (A) UV−vis spectra of 1 at pH 1.86 (–○–), pH 4.08 (−−−−), pH 8.07 (⎯⎯⎯), pH 11.90 (⎯△⎯) and pH 13.01 (⎯●⎯). [1] = 0.02 mM (B) The acidic pKa of 1 was determined at 503 nm (⎯○⎯). The absorbance at 503 nm (A503) decreases between pH 2–6. The non−linear curve fit was performed using the equation, (C) The basic pKa of 1 was determined at 428 nm (⎯○⎯) and 500 nm (⎯●⎯).Between pH 8 to 13, the absorbance 428 nm (A428) decreases but the absorbance at 500 nm (A500) increases. The non−linear curve fit was performed using the following equations, and . AH is the monoprotonated, A is the neutral and A− is the monoanion species of 1. (D) The pKa assignment of 1.

