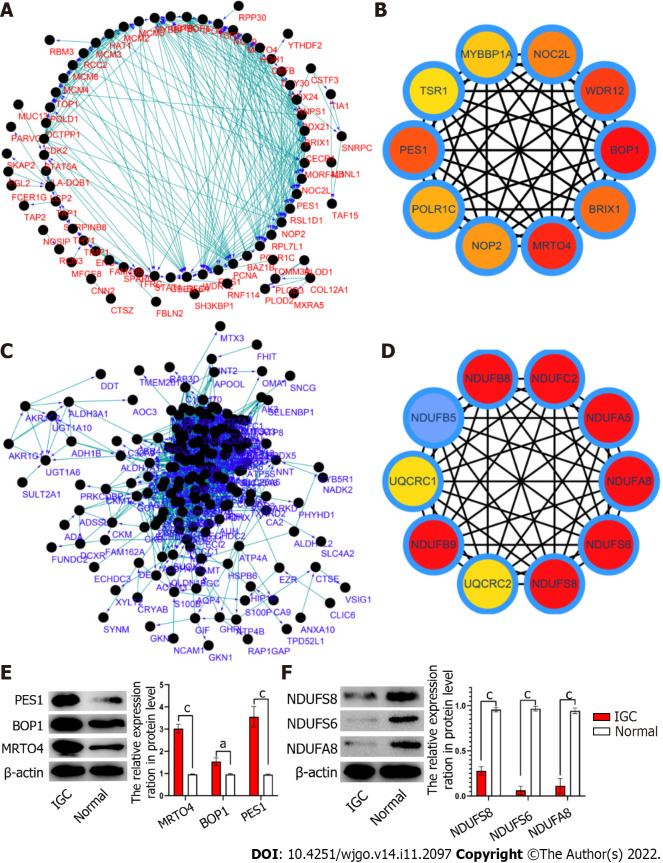
Figure 3.
Protein interaction networks of differentially expressed proteins. A and B: The interaction network of the significantly up-regulated proteins (A) in infiltrative gastric cancer (IGC) and the top 10 proteins (B); C: The interaction network of the significantly down-regulated proteins (C) in IGC and the top 10 proteins (D); E and F: Representative immunoblots showing the expression levels of specific up-regulated (E) and down-regulated (F) proteins in IGC tissues. aP < 0.05; cP < 0.001.

