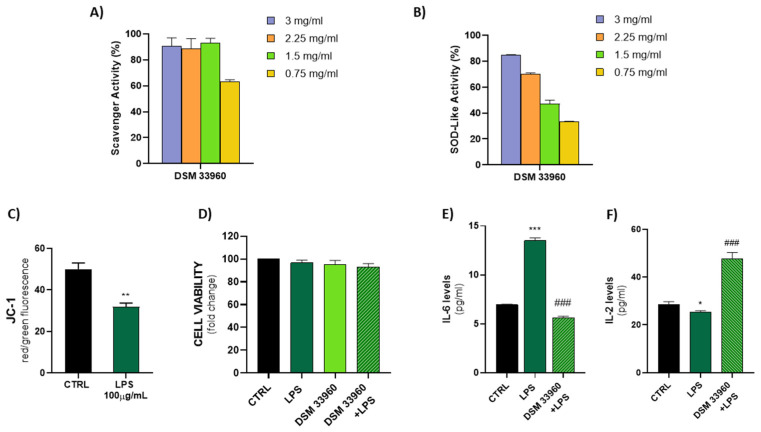
Figure 3.
DPPH scavenger and SOD-like activity explicated by the CA15 (DSM 33960) strain tested at different concentrations (3, 2.25, 1.5, and 0.75 mg/mL) (Panels A,B); LPS treatment (100 µg/mL) effect on mitochondrial membrane potential (Panel C) (** p < 0.005 vs. CTRL); Assessment of Caco-2 cell viability after treatments (Panel D); Measurement of IL-6 and IL-2 levels in cell supernatants by ELISA (Panels E,F) (* p < 0.05, *** p < 0.0005 vs. CTRL; and ### p < 0.0005 vs. LPS).

