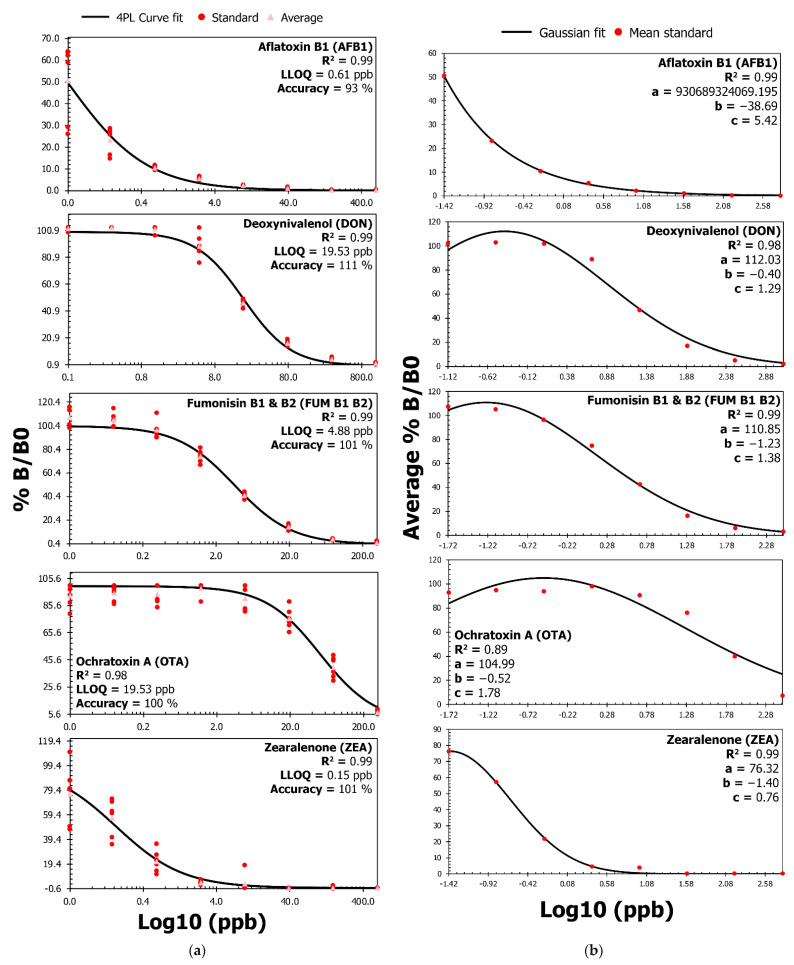
Figure 1.
Calibration curves with a 4PL and Gaussian fit for AFB1, DON, FUM, OTA, and ZEA. (a) The assay can accurately measure low amounts of analyte as the four-parameter logistic (4PL) curve establishes a near-perfect fit (R²) for all mycotoxins. The coefficient of determination (R²) is the ratio of the variation that the 4PL curve-fitting model explains to the total variation in the model. The R² value will equal 1 for a perfect fit and will be closer to 0 for a bad 4PL fit. Furthermore, the lower limit of quantitation (LLOQ) is the lowest amount of an analyte detectable in a sample with suitable accuracy. As a result, Figure 1a presents the LLOQ in ppb for each mycotoxin and the associated accuracy percentages at the LLOQs achieved through back-calculation. (b) Gaussian curve fit analysis and associated coefficient values used to predict the concentration (in ng/mL or ppb) for recovery and the matrix interference analysis are in Table 1. The a, b, and c Gaussian coefficients refer to the height of the curve’s peak, the position of the center of the peak, and the standard deviation, respectively. In panels a and b, %B/B0 refers to the OD value with (B) and without (B0) competition for antibody binding sites on the microplate.

