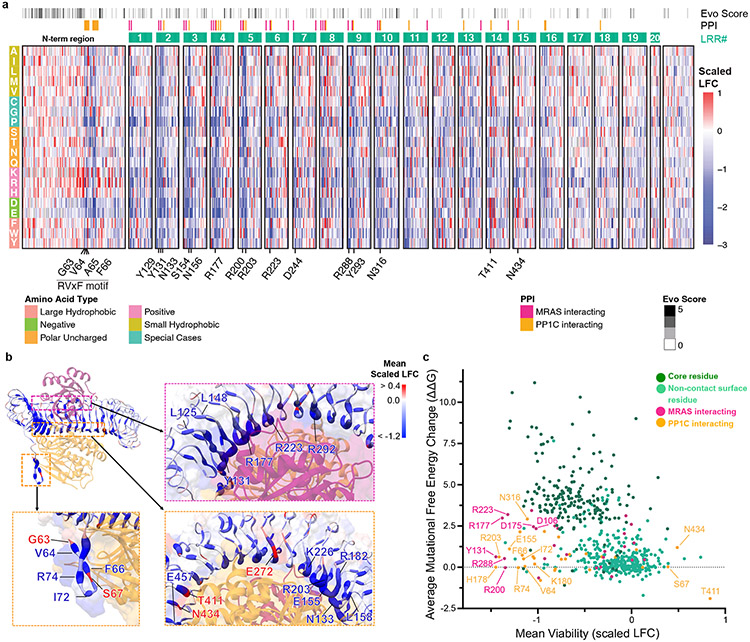
Figure 3: Systematic deep mutational scanning (DMS) reveals structural constraints of SHOC2 complex function.
a. Heat map representation of log2-fold change (LFC) allele enrichment (red) and depletion (blue) between trametinib treatment and vehicle control, centered on SHOC2 wildtype (silent) and normalized to the mean of non-sense mutations (scaled LFC). SHOC2 positional evolutionary sequence variation (Evo Score) and protein-protein interacting residues (PPI) from cryo-EM data are indicated. b. Projections of observed DMS allele abundance on N-terminal unstructured region (bottom left), and MRAS (top right) and PP1C interface (bottom right) onto Cryo-EM structure. Color indicates mean positional Scaled LFC in the DMS fitness screen and size of residue indicates number of variants that score as GOF/LOF. c. Scatter plot showing position-level calculated, mean free-energy change upon mutation (intrinsic SHOC2 stability) and corresponding average scaled LFC for fitness in the SHOC2 DMS screen, with higher ddG values correspond to greater instability. Positive DMS scaled LFC: positive selection, GOF. Negative DMS Z-score: negative selection, LOF.

