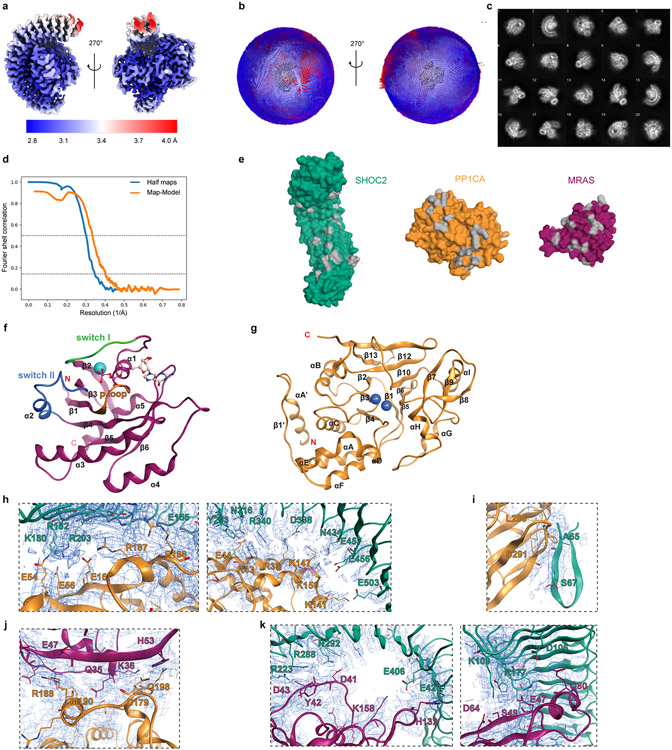
Extended Data Figure 1. Cryo-EM map of the SHOC2 holophosphatase complex, surface model of contact surfaces and secondary structure annotations.
a, The cryo-EM map used for modeling the complex, colored according to local resolution using the color map shown. The map was sharpened by an automatically determined B-factor of −90.7922 Å2 and filtered to local resolution, both determined by the methods implemented in Relion. b, A 3D histogram of the angular distribution in the final particle set as determined during the final 3D map refinement. Both the size and color of the bins correspond to particle counts. The views are the same as shown in (a), with the map itself rendered in the center of the histograms in grey. c, Reference-free 2D class averages generated from the final particle set. d, The fourier shell correlation (FSC) for the independently refined half maps from the final 3D map refinement (blue), and the full map and atomic model (orange). The “gold standard” half-maps FSC was calculated and corrected for masking effects using Relion; the map-model FSC was calculated by Phenix using a mask around the model based on the 2.9 Å global resolution. FSC=0.5 and 0.143 thresholds are marked by dashed lines. The half-maps FSC crosses the 0.143 threshold at 2.8925 Å resolution, and the map-model FSC crosses the 0.5 threshold at 3.01 Å resolution. e, Surface model of unbound SHOC2, PP1CA, and MRAS. Grey indicates the interacting surfaces. f, MRAS cartoon representation with secondary structured labeled. g, PP1CA cartoon representation with secondary structured labeled. h, SHOC2 LRR and PP1C interactions i, SHOC2 N-term region and PP1C j, PP1C and MRAS k, SHOC2 LRR and MRAS shown in local electron density map corresponding to protein-protein interaction sites in Figure 4. SHOC2 is shown in teal, PP1CA in yellow and MRAS in magenta. The map (2Fo-Fc) is at 4.5 sigma.

