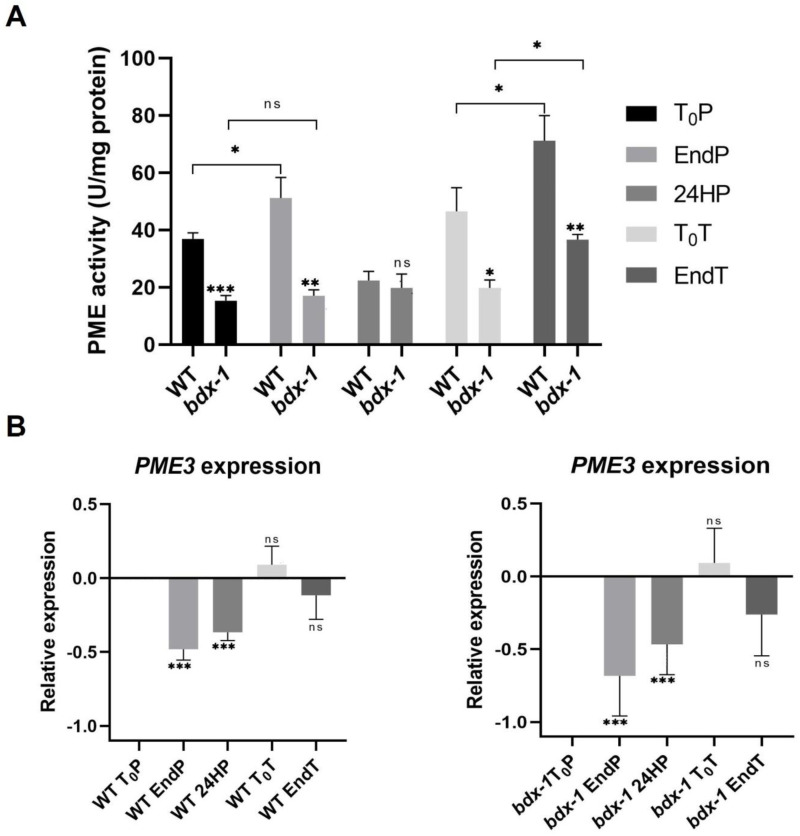
Figure 4.
PME activity and AtPME3 expression of WT and bdx-1 lines during thermotolerance and thermomemory. (A) Effect of priming and triggering on the total PME activity of WT and bdx-1 seedlings. Error bars indicate SEM (n = 4). Statistical analyses were performed using Student’s t-test. Asterisks indicate statistically significant differences between WT and bdx-1 and between treatments (* p < 0.05, ** p < 0.01, *** p < 0.001). (B) Effect of priming and triggering on expression levels of AtPME3 in WT and bdx-1 seedlings. The expression values are relative to T0P expression. Error bars indicate S.D. (n = 3). Statistical analyses were performed using Student’s t-test. Asterisks indicate statistically significant differences to T0P (* p < 0.05, ** p < 0.01, *** p < 0.001, ns, not significant).

