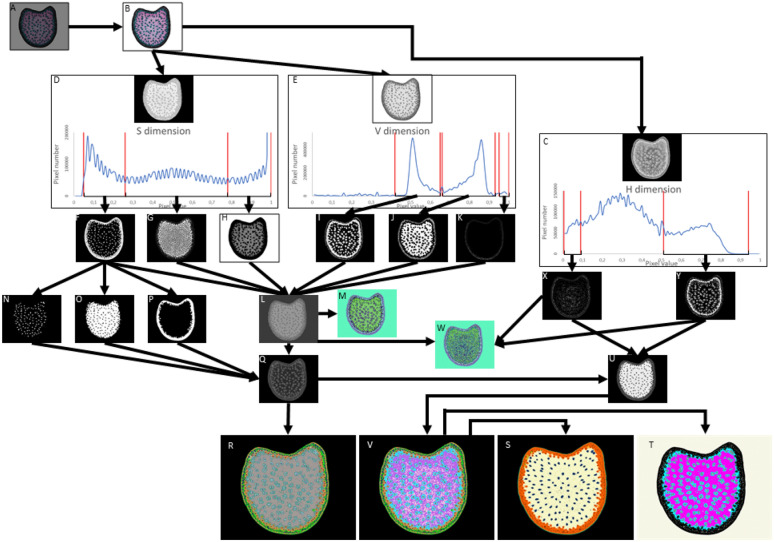
Fig. 1.
Overview Workflow. A Maize FASGA stained internode cross section image. B Maize FASGA stained internode cross sections resulting of 3 repetitions of mean radius 2. C Image of H dimension and the distribution of the number of pixels according to their H values. D Image of S dimension and the distribution of the number of pixels according to their S values E Image of V dimension and the distribution of the number of pixels according to their V values F Selection of pixels with S value between 0.05 and 0.26. G Selection of pixels with S value between 0.26 and 0.78. H Selection of pixels with S value between 0.78 and 1. I Selection of pixels with V value between 0.42 and 0.65. J Selection of pixels with V value between 0.66 and 0.93. K Selection of pixels with V value between 0.95 and 1. L Filter addition spectrum. M Color code image of image presentation in panel L. N Density spectrum corresponding to bundles in parenchyma. O Density spectrum representing pith and light rind P Density spectrum representing dark rind. Q Filter addition spectrum with spacial segmentation. R FASGA3, Filter addition spectrum with special segmentation colored. S Segmentation in 5 histological regions. T Segmentation of the tissues of the cross section according to Legland et al. U Image segmentation with H option filter colored V Image segmentation with H option filter colored. W Color code image of image presentation in panel L and including segmentation with H dimension. X Selection of pixels according to their H value between 0.005 and 0.09 Y Selection of pixels according to their H value between 0.51 and 0.94

