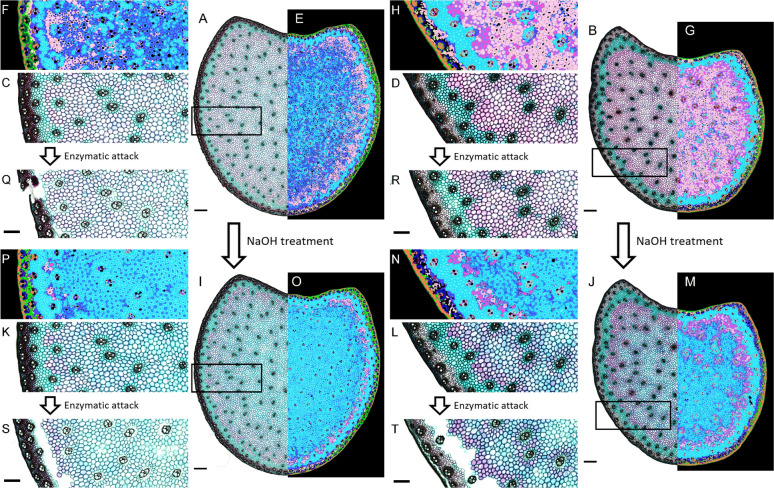
Fig. 2.
Enzymatic digestion on maize cross section. A Maize hybrid FASGA stained internode cross section. B Maize inbred line FASGA stained internode cross section. C Focus on part of panel A. D Focus on part of panel B. E Color segmentation images resulting from the proposed workflow on cross section presented in panel A. F Color segmentation image resulting from the proposed workflow of panel C. G Color segmentation image resulting from the proposed workflow on cross section presented in panel B. H Color segmentation image resulting from the proposed workflow of panel D. I Maize hybrid internode cross section treated with 0.1 M NAOH solution and stained with FASGA solution. J Maize inbred line internode cross sections treated with 0.1 M NAOH solution and stained with FASGA solution. K Focus on part of panel I. L Focus on part of panel J. M Color segmentation images resulting from the proposed method on cross section presented in panel J panel. N Color segmentation images resulting from the proposed method of panel L. O Color segmentation images resulting from the proposed method on dash point region of cross section presented in panel H panel. P Color segmentation images resulting from the proposed method of panel I. Q Maize hybrid cross sections treated with cellulase solution and stained with FASGA. R Maize inbred lines cross sections treated with cellulase solution and stained with FASGA. S Maize hybrid cross sections treated with NaOH 0.1 M, cellulase solution and stained with FASGA. T Maize inbred lines cross sections treated with NaOH 0.1 M, cellulase solution and stained with FASGA. Q, R, S and T Cross section treated with cellulase corresponding to focuses presented in panel C, D, K and L respectively. A, B, E, G, I, J, O and M Scale bar = 1000 µm. C, D, F, H, K, L, N, P, Q, R, S and T Scale bar = 500 µm.

