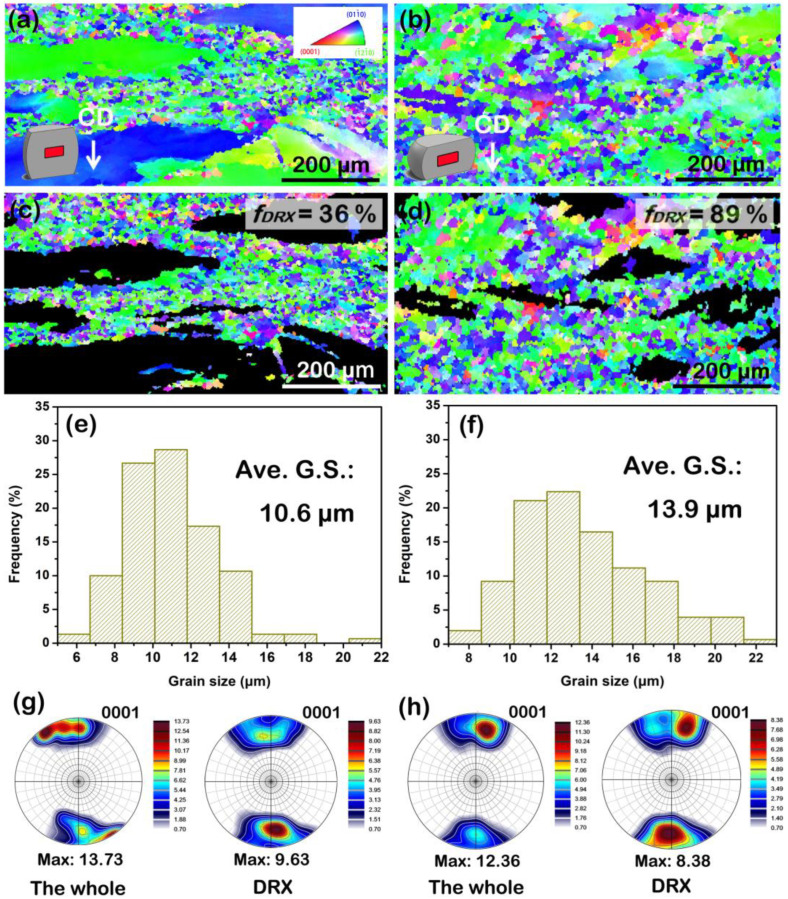
Figure 11.
(a,b) EBSD images of the solution-treated BX31 alloy during the hot compressive strains of 0.3 and 0.5 at 623 K and 0.01 s−1, respectively. CD represents the compressive direction; (c,d) DRX regions selected from (a) and (b), respectively; (e,f) grain size distribution maps of DRX regions from (c) and (d), respectively; (g,h) (0001) pole figures containing the whole and DRX areas of the samples with 0.3 and 0.5 strains, respectively.

