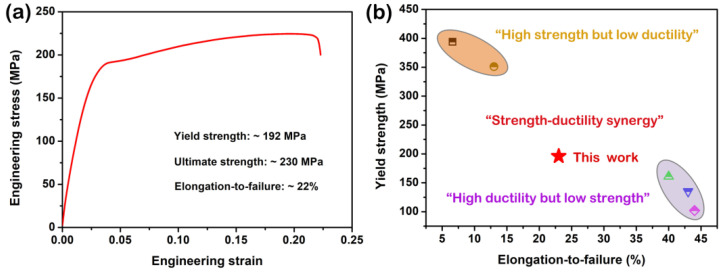
Figure 15.
(a) Tensile engineering stress–strain curve of the as-extruded BX31 alloy; (b) relationship between the ultimate strength and the elongation-to-failure for this work (marked by red star) and the reported other Mg-Bi-Ca series alloys (labeled by different symbols). Note that orange and gray circles represent “high strength but low ductility” and “high ductility but low strength” regions, respectively. Reproduced with permission from Refs. [17,18,19,20]. Copyright 2020, 2022, Elsevier, MDPI.

