
Table 4.
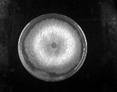
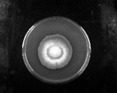
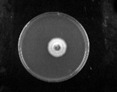
The average mycelium inhibition rates (%) of rhamnolipids (200 mg/L) against five plant pathogenic fungi.
| Fungi | Control | Inhibition Rate % | ||
|---|---|---|---|---|
| DR25 | DR46 | DR90 | ||
| P. capsici |
|
 62.89 ± 4.01 |
 71.22 ± 1.98 |
 100 |
| P. nicotianae |
|
 29.10 ± 1.31 |
 34.26 ± 1.10 |
 66.21 ± 3.06 |
| C.sublineolum |
|
 42.59 ± 2.43 |
 72.42 ± 0.53 |
 79.27 ± 2.15 |
| F. oxysporum |
|
 40.07 ± 1.54 |
 70.94 ± 2.47 |
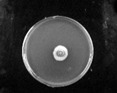 78.03 ± 2.40 |
| C. destructivum. |
|
 59.97 ± 0.95 |
 66.57 ± 0.62 |
 78.68 ± 3.06 |